Layer
介绍
Baffalo_Layer 作为一个类似于图层的类,他可以存储不同的元素(点、线、网格),且更加关注不同元素间的计算和转换。
主要参考的工具箱或代码:Gibbon$^{[1][2]}$,MRST$^{[3]}$
案例
LoftLinear (Flag=1)
%% Bottom verts
ns=75;
t=linspace(0,2*pi,ns);
t=t(1:end-1);
r=5;
x=r*cos(t);
y=r*sin(t);
a=Point2D('Bottom Verts');
a=AddPoint(a,x',y');
Plot(a);
%% Top verts
t=linspace(0,2*pi,ns);
t=t(1:end-1);
r=6+2.*sin(5*t);
[x,y] = pol2cart(t,r);
a1=Point2D('Top Verts');
a1=AddPoint(a1,x',y');
Plot(a1);
%% Layer
l1=Layer('Layer');
l1=AddElement(l1,a);
l1=AddElement(l1,a1,'transform',[6,3,12,0,0,90]);
Plot(l1);
l1=LoftLinear(l1,1,2,'closeLoopOpt',1,'patchType','tri_slash');
l1=LoftLinear(l1,1,2,'closeLoopOpt',1,'patchType','tri');
l1=Move(l1,[20,0,0],'Meshes',1);
Plot(l1);
通过点loft出曲面。
 |  |
 |  |
Extrude to face (Flag=2)
%% Bottom verts
ns=75;
t=linspace(0,2*pi,ns);
t=t(1:end-1);
r=5;
x=r*cos(t);
y=r*sin(t);
a=Point2D('Bottom Verts');
a=AddPoint(a,x',y');
Plot(a);
%% Top verts
t=linspace(0,2*pi,ns);
t=t(1:end-1);
r=6+2.*sin(5*t);
[x,y] = pol2cart(t,r);
a1=Point2D('Top Verts');
a1=AddPoint(a1,x',y');
Plot(a1);
%% Layer
l1=Layer('Layer');
l1=AddElement(l1,a);
l1=AddElement(l1,a1,'transform',[6,3,12,0,0,90]);
Plot(l1);
l1=LoftLinear(l1,1,2,'closeLoopOpt',1,'patchType','tri_slash');
l1=LoftLinear(l1,1,2,'closeLoopOpt',1,'patchType','tri');
l1=Move(l1,[20,0,0],'Meshes',1);
Plot(l1);
拉伸出曲面。
 |  |
Helical Line (Flag=3)
%% Creat circle
a=Point2D('Point');
a=AddPoint(a,0,0);
b=Line2D('Line');
b=AddCircle(b,10,a,1,'seg',80);
l1=Layer('Layer1');
l1=AddElement(l1,b);
Plot(l1);
l1=Move(l1,[zeros(80,1),zeros(80,1),0.1*(0:79)'],'Lines',1);
Plot(l1);
for i=1:9
l1=Move(l1,[0,0,0.1*80*i],'Lines',1,'new',1);
end
Plot(l1);
生成螺旋线。
 |  |

Add Mesh (Flag=4)
%% Creat circle
a=Point2D('Point');
a=AddPoint(a,0,0);
b=Line2D('Line');
b=AddEllipse(b,20,20,a,1,'ang',80);
mm=Mesh('Shell Mesh');
mm=Rot2Shell(mm,b,'Slice',72,'Type',2);
mm=ReverseNormals(mm);
l1=Layer('Layer1');
l1=AddElement(l1,mm,'Transform',[0,0,0,-90,0,0]);
Plot(l1);
m1=Mesh2D('Mesh1');
m1=MeshQuadPlate(m1,[50,50]);
Plot(m1);
l1=AddElement(l1,m1,'Transform',[0,0,0,-80,0,0]);
l1=AddElement(l1,m1,'Transform',[0,0,0,-60,0,0]);
l1=AddElement(l1,m1,'Transform',[0,0,0,-40,0,0]);
l1=AddElement(l1,m1,'Transform',[0,0,0,-20,0,0]);
% l1=AddElement(l,m1,'Transform',[0,0,0,-80,0,0]);
% l1=AddElement(l,m1,'Transform',[0,5,0,-80,0,0]);
% l1=AddElement(l,m1,'Transform',[0,10,0,-80,0,0]);
% l1=AddElement(l,m1,'Transform',[0,15,0,-80,0,0]);
% l1=AddElement(l,m1,'Transform',[0,0,0,0,0,0]);
% l1=AddElement(l,m1,'Transform',[0,0,5,0,0,0]);
% l1=AddElement(l,m1,'Transform',[0,0,10,0,0,0]);
% l1=AddElement(l,m1,'Transform',[0,0,15,0,0,0]);
Plot(l1);
加入网格。
 |  |

Add Curve and calculate curvature (Flag=5)
N = 101;
theta = linspace(0,pi,N);
x = sin(2*theta);
y = cos(4*theta);
z = cos(6*theta);
P = [x',y',z'];
l1=Layer('Layer1');
l1=AddCurve(l1,P);
Plot(l1);
[L,R,K,~] = CalculateCurvature(l1,1);
figure;
plot(L,1./R)
xlabel L
ylabel R
title('Curvature vs. cumulative curve length')
figure;
h = plot3(P(:,1),P(:,2),P(:,3));
grid on;
axis equal
set(h,'marker','.');
xlabel x
ylabel y
zlabel z
title('3D curve with curvature vectors')
hold on
quiver3(P(:,1),P(:,2),P(:,3),K(:,1),K(:,2),K(:,3));
hold off
曲线曲率计算参考于$^{[4]}$,用于计算空间中曲线的曲率。
 |  |
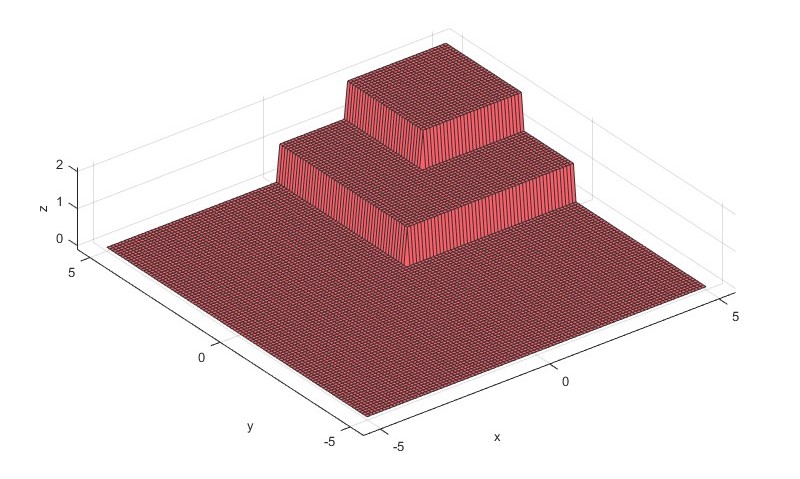
Add thickness of a plate (Flag=6)
m=Mesh2D('Mesh1');
m=MeshQuadPlate(m,[10,10],[100,100]);
l1=Layer('Layer1');
l1=AddElement(l1,m);
f=@(x,y,z)and(x>0,y>0);
l1=AddHeight(l1,1,1,'fun',f);
f=@(x,y,z)and(x>2,y>2);
l1=AddHeight(l1,1,1,'fun',f);
Plot(l1)
对一个平板增加高度。
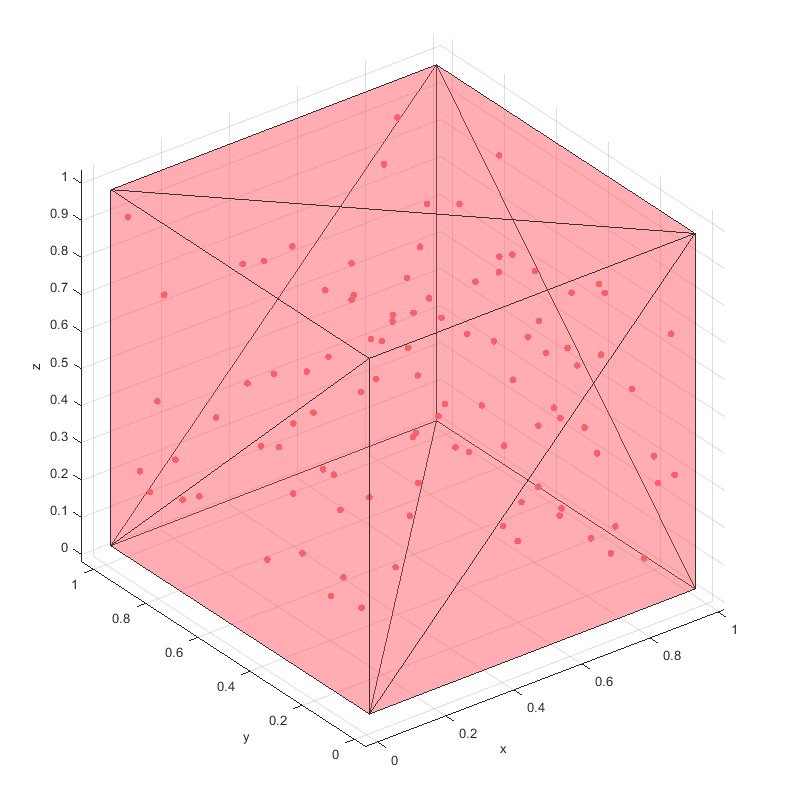
Bounding Box (Flag=7)
points=rand(100,3);
l1=Layer('Layer1');
l1=AddPoint(l1,points);
l1=BoundingBox(l1,1);
Plot(l1,'face_alpha',0.3);
计算空间中点包络。
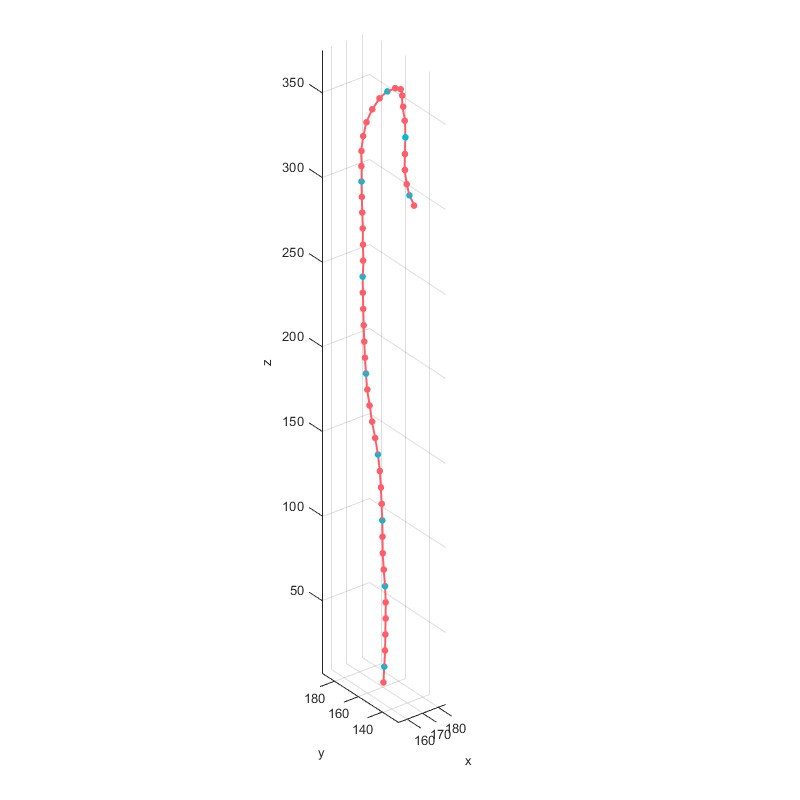
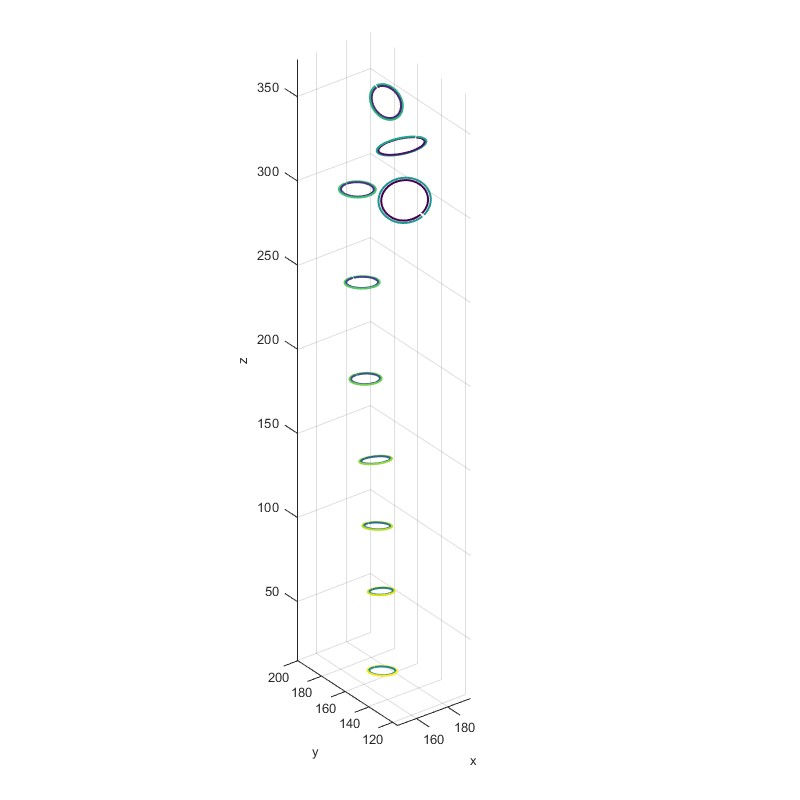
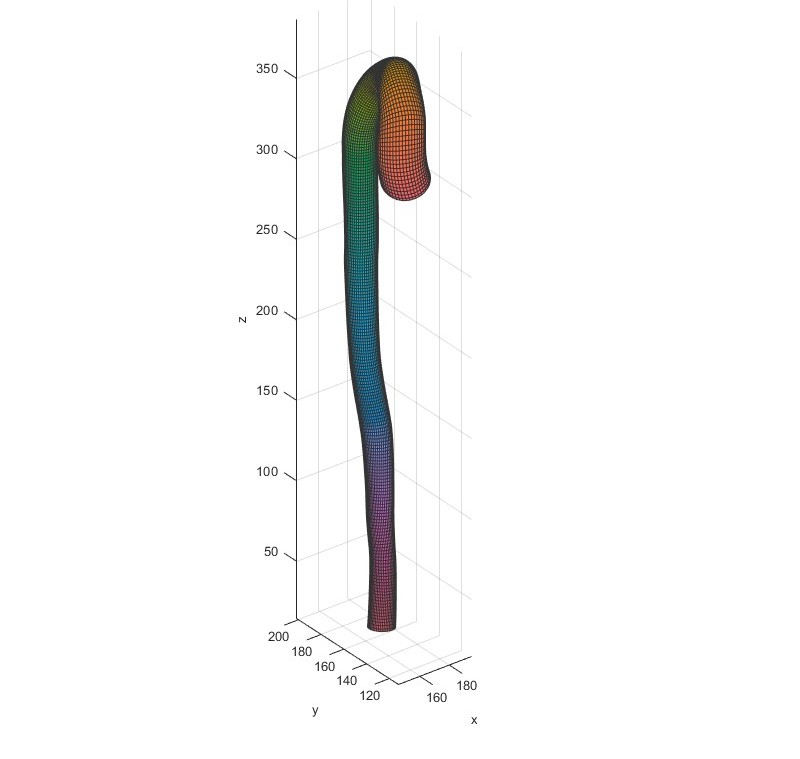
Sweep loft (Flag=8)
%% Load data as structure
dataStruct=load('Concannon_aorta_segmentation.mat');
%Define smoothing Parameters
pointSpacing=1.7;
smoothFactorCentreLine=0.01; %Cubic smooth spline parameter [0-1] use empty to turn off
smoothFactorSegments=0.01; %Cubic smooth spline parameter [0-1], 0=straight line, 1=cubic
%% Access data structure components
V_cent=dataStruct.Cent; %Centroid list
segmentCell=dataStruct.Points; %Lumen boundary coordinates
%Define thickness information
dataStruct.WallThickness=[1.425 0.9 1 1.025 0.833333333 0.891666667 0.95 0.975 0.9 0.825];
wallThickness=dataStruct.WallThickness; %Raw data for wall thickness as a function of location
%% Resampling aorta section contours
%Resample boundary points so each plane has same number of points for lofting
%Find number of points to use based on biggest circumference
d=zeros(size(segmentCell,2),1);
SegNum=size(segmentCell,2);
l1=Layer('Layer1');% Original Curve
for indNow=1:1:SegNum
l1=AddCurve(l1,segmentCell{1,indNow}');
[Length,~,~,~] = CalculateCurvature(l1,indNow);
d(indNow)=max(Length);
end
nSegment=round(max(d)/pointSpacing);
%Resample
segmentCellSmooth=segmentCell;
segmentCellMean=segmentCell;
w=ones(size(V_cent,1),1); %Cubic smoothing spline weights
indexPlanePoints_V_cent=zeros(1,size(segmentCell,2)); %Indices of centre line points at sections
for indNow=1:1:SegNum
%Resample section contour
l1=RebuildCurve(l1,indNow,nSegment,'interpPar',smoothFactorSegments,'closeLoopOpt',1);
Num=GetNLines(l1);
Vs_1_mean=mean(l1.Lines{Num,1}.P,1);
segmentCellSmooth{1,indNow}=l1.Lines{Num,1}.P';
segmentCellMean{1,indNow}=Vs_1_mean;
%Prepare for center line smoothing by setting weight vector
[~,indVertex_1]=min(sqrt(sum((V_cent-Vs_1_mean(ones(size(V_cent,1),1),:)).^2,2))); %Index closest to section
w(indVertex_1)=1e9; %Heigh weight at contour sections
indexPlanePoints_V_cent(indNow)=indVertex_1; %Store index of closets
end
%% Smooth center line
%Fit smoothing spline through centreline points for loft
l2=Layer('Layer2');
if ~isempty(smoothFactorCentreLine)
V_cent_original=V_cent;
l2=AddCurve(l2,V_cent_original);
[d,~,~,~] = CalculateCurvature(l2,1);
V_cent = csaps(d,V_cent_original',smoothFactorCentreLine,d,w)'; %Smoothed
l2=AddPoint(l2,V_cent);
l2=AddPoint(l2,V_cent(w==max(w),:));
Plot(l2)
end
%% Offsetting section curves outward if thickening is inward
for q=1:SegNum
l1=CurveOffset(l1,SegNum+q,wallThickness(q));
Num=GetNLines(l1);
segmentCellSmooth{1,q}=l1.Lines{Num,1}.P';
end
%% Visualize offset curves
Plot(l1,'lineson',1,'group',(SegNum+1:SegNum*3)')
%% Perform main trunk loft
% Initialize figure with center line
l1=AddCurve(l1,V_cent);
controlParameter.n=100;
controlParameter.Method='HC';
l1=SweepLoft(l1,(SegNum*2+1:SegNum*3)',GetNLines(l1),'PointSpacing',pointSpacing,'Smooth',controlParameter);
Plot(l1,'Lineson',0)
 |  |
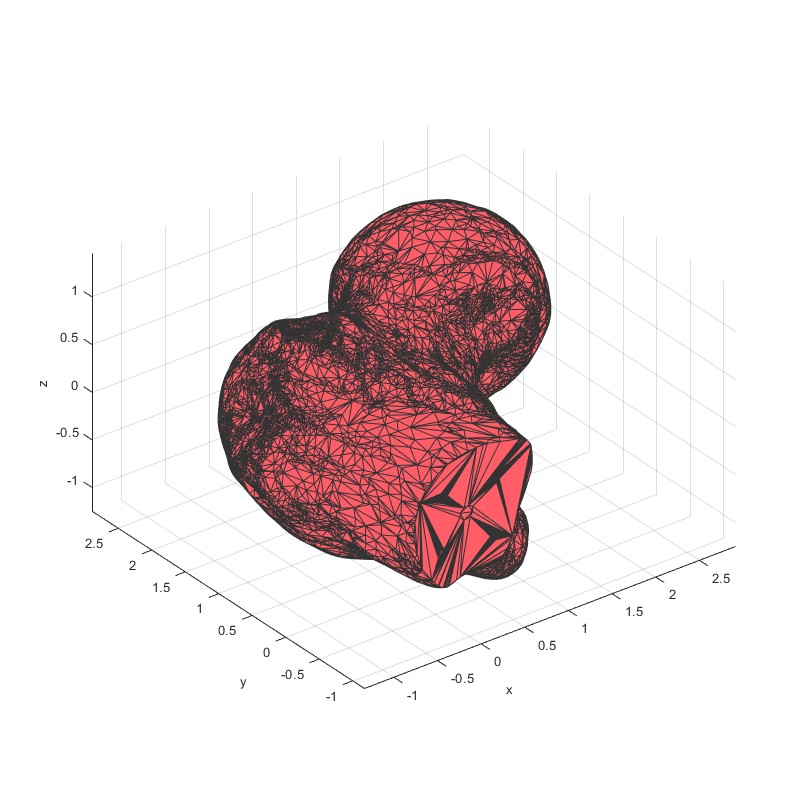
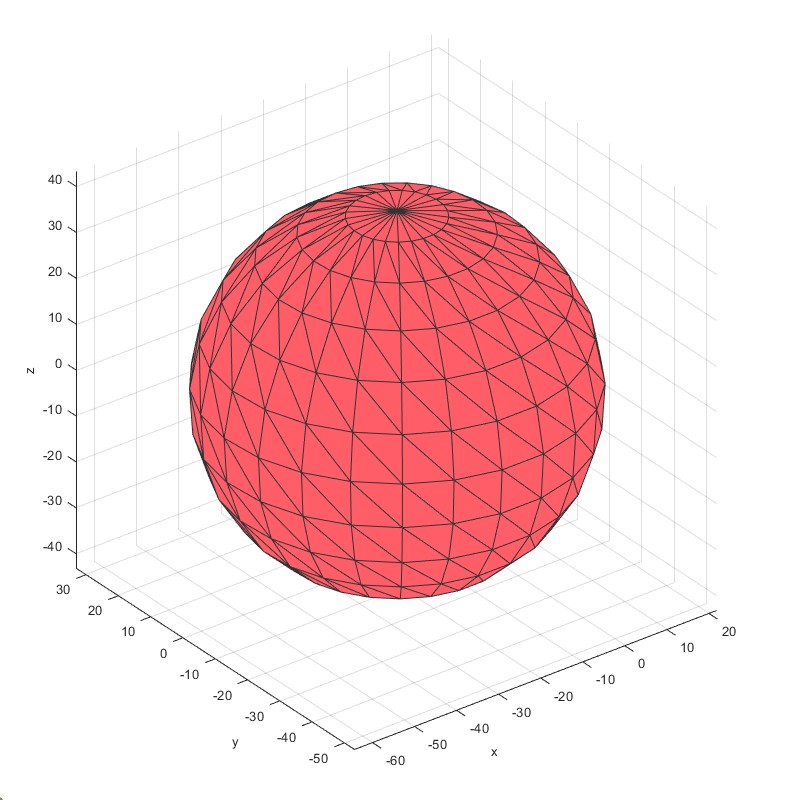
Read STL file (Flag=9)
l1=Layer('Layer1');
l1=STLRead(l1,'femur_binary.stl');
Plot(l1);
l2=Layer('Layer2');
l2=STLRead(l2,'sphere_ascii.stl');
% STLRead(l2,'pallet_montado.stl');
Plot(l2);
读取stl文件。
 |  |
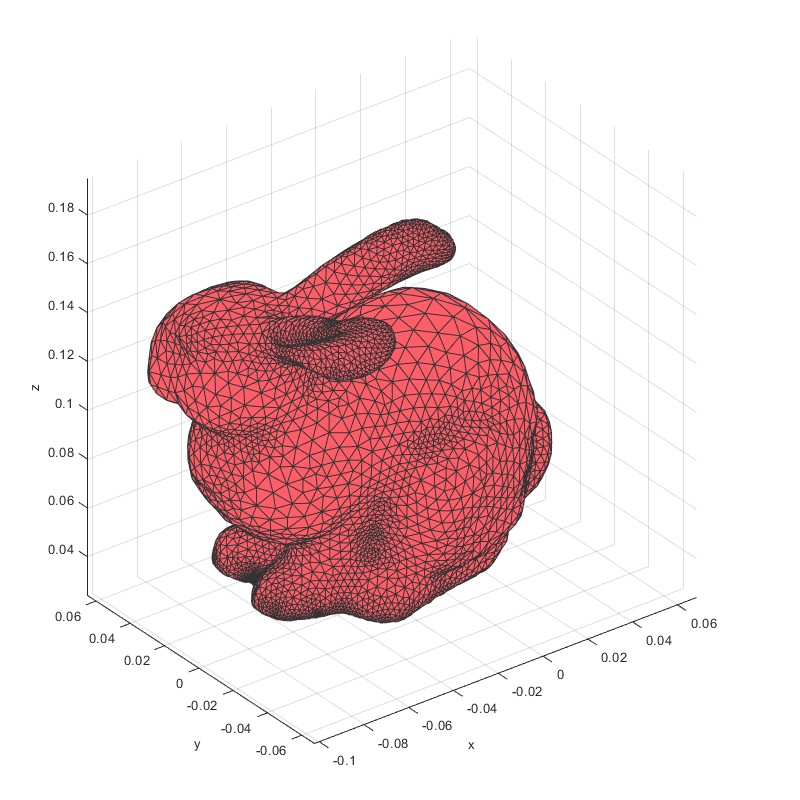
Read msh file (Flag=10)
l1=Layer('Layer1');
l1=LoadMsh(l1,'bunny.msh');
Plot(l1)
读取msh文件
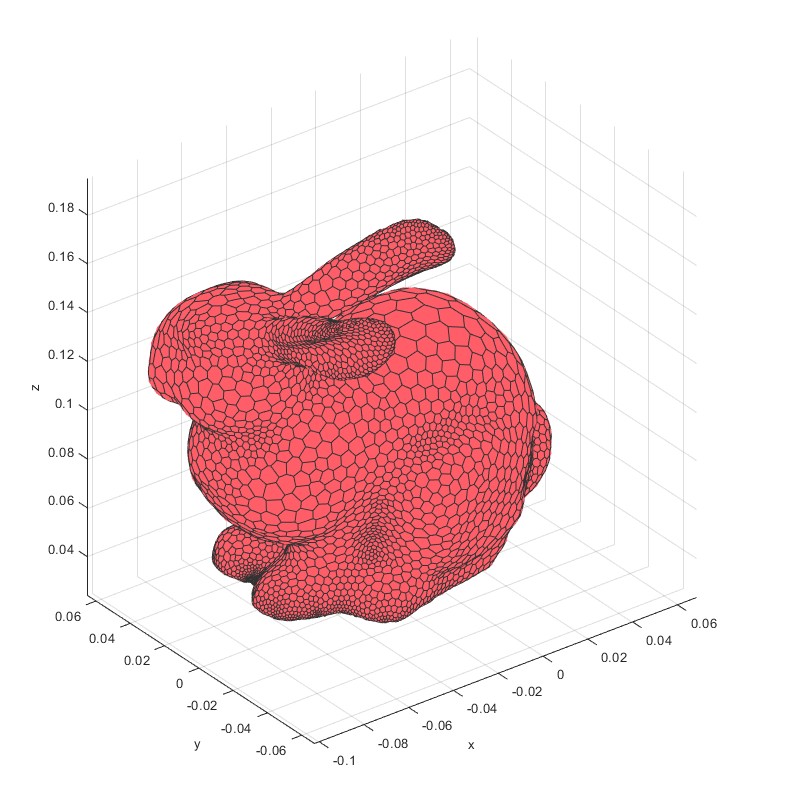
Tri to Dual (Flag=11)
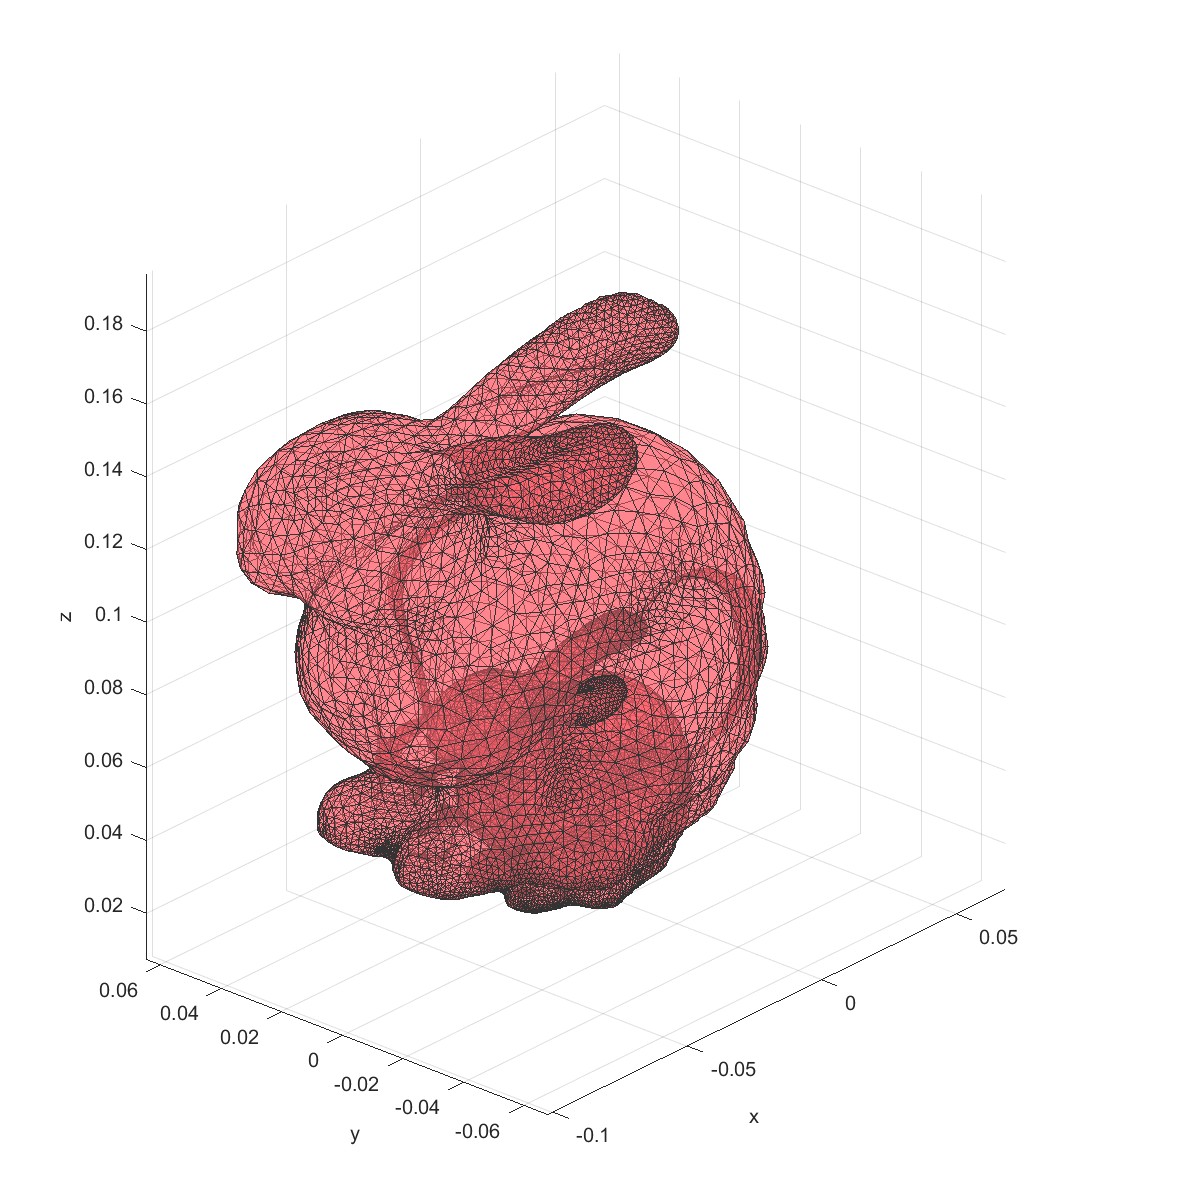
l1=Layer('Layer1');
l1=LoadMsh(l1,'bunny.msh');
l1=Tri2Dual(l1,1);
Plot(l1,'mesheson',0);
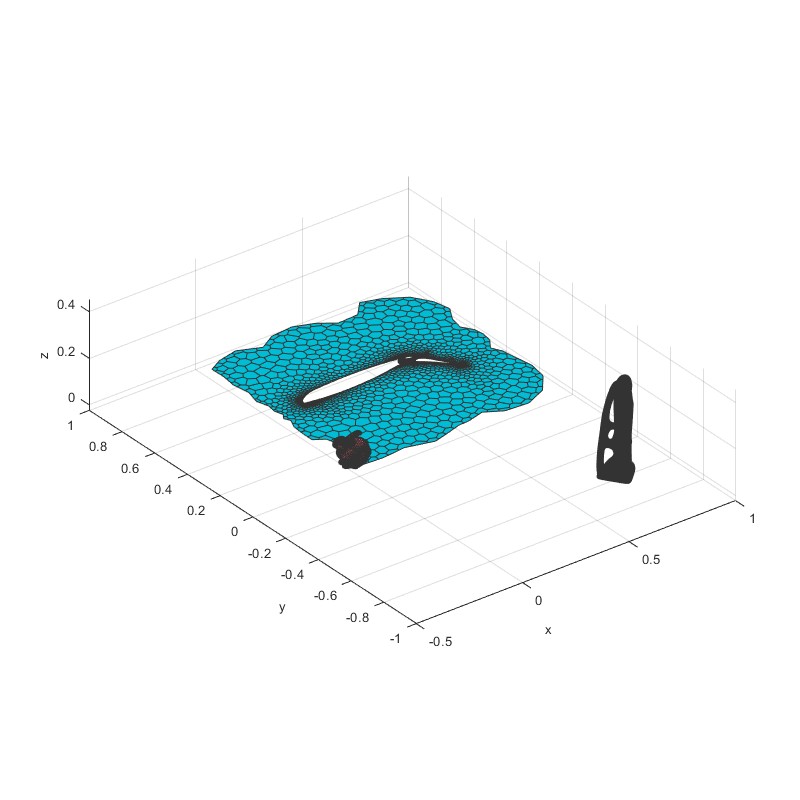
m=Mesh2D('Mesh1');
m=LoadMsh(m,'airfoil.msh');
m=MeshDual(m);
l1=AddElement(l1,m);
l1=LoadMsh(l1,'thinker.msh');
l1=Tri2Dual(l1,3);
Plot(l1,'mesheson',0,'xlim',[-0.5,1],'ylim',[-1,1]);
将三角形网格转化为多边形网格
 |  |
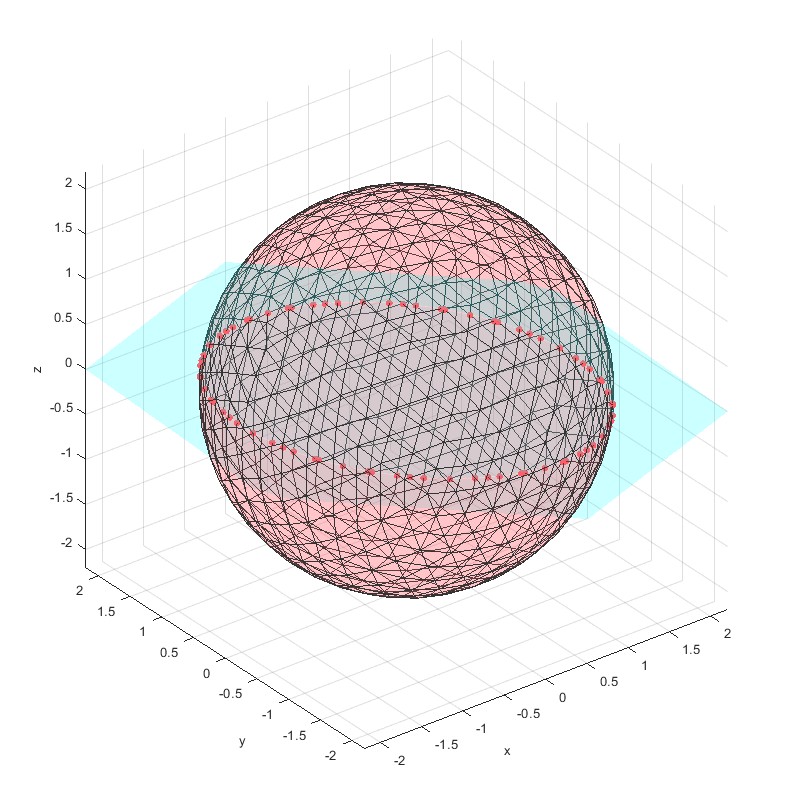
Plane Mesh intersections (Flag=12)
%Sphere parameters
numRefineStepsSphere=3;
sphereRadius=2;
mm=Mesh('Demo Sphere Mesh');
mm=MeshSphere(mm,numRefineStepsSphere,sphereRadius);
mm=Mesh3D(mm);
l1=Layer('Layer1');
l1=AddElement(l1,mm);
pos=[0,0,0];
vec=[1,1,1];
l1=AddPlane(l1,pos,vec);
l1=IntersectPlaneMesh(l1,1,1);
Plot(l1,'face_alpha',0.2,'planescale',3);
计算平面与网格的交点。
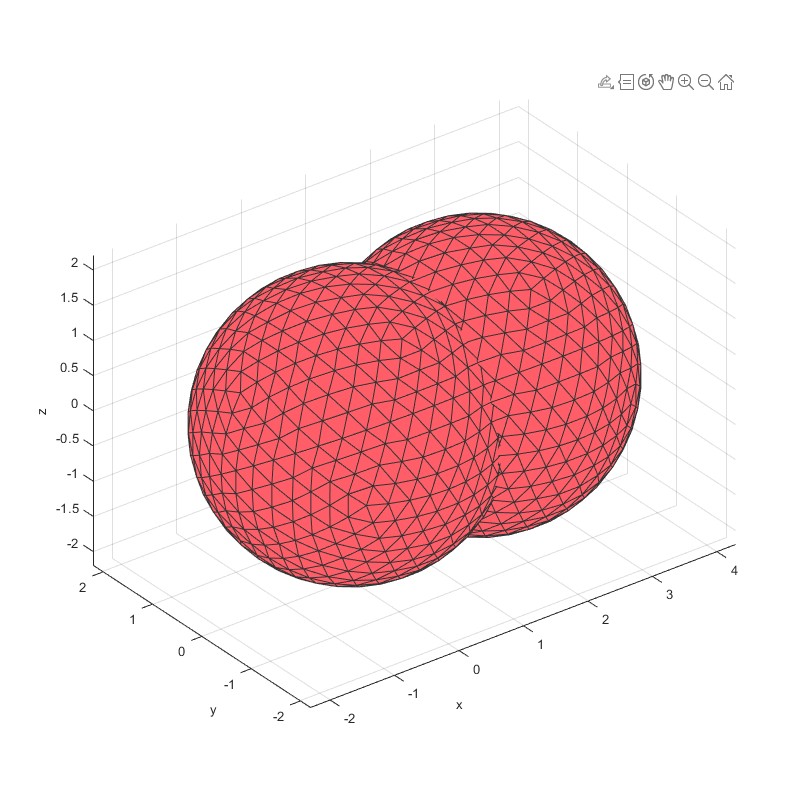
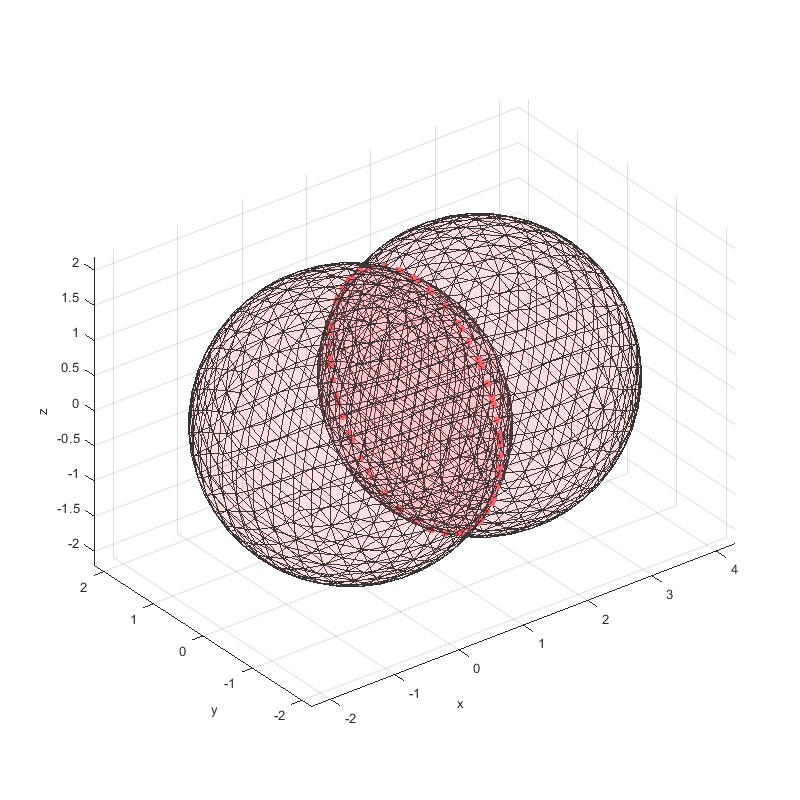
Mesh Mesh intersections (Flag=13)
%Sphere parameters
numRefineStepsSphere=3;
sphereRadius=2;
mm=Mesh('Demo Sphere Mesh');
mm=MeshSphere(mm,numRefineStepsSphere,sphereRadius);
mm=Mesh3D(mm);
l1=Layer('Layer1');![[Assets/RoTA_Layer.assets/Fig27.jpg]]
l1=AddElement(l1,mm);
l1=AddElement(l1,mm,'Transform',[2,0,0,0,0,0]);
Plot(l1)
[Slice,~,~]=IntersectMeshMesh(l1,1,2);
Plot(l1,'face_alpha',0.1);
Plot(Slice);
计算网格与网格间的交点
 |  |
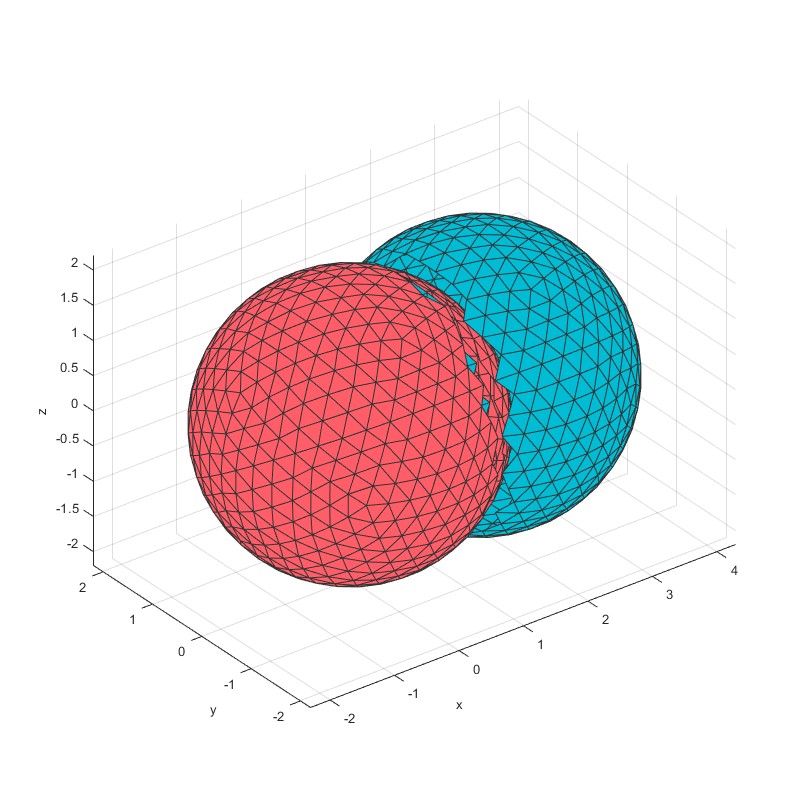
Combine Mesh pair (Flag=14)
%Sphere parameters
numRefineStepsSphere=3;
sphereRadius=2;
mm=Mesh('Demo Sphere Mesh');
mm=MeshSphere(mm,numRefineStepsSphere,sphereRadius);
mm=Mesh3D(mm);
l1=Layer('Layer1');
l1=AddElement(l1,mm);
l1=AddElement(l1,mm,'Transform',[2,0,0,0,0,0]);
[~,m1,m2]=IntersectMeshMesh(l1,1,2);
m1=KeepGroup(m1,1);
m2=KeepGroup(m2,2);
PlotFace(m1);
PlotFace(m2);
l2=Layer('Layer2');
l2=AddElement(l2,m1);AddElement(l2,m2);
Plot(l2);
l2=CombineMeshPair(l2,1,2,'reverse',1);
l2=Move(l2,[10,0,0],'Meshes',3);
Plot(l2);
l2=CombineMeshPair(l2,1,2,'remesh',0.2,'reverse',1);
l2=Move(l2,[20,0,0],'Meshes',4);
Plot(l2);
l2=Tri2Dual(l2,4);
l2=Move(l2,[10,0,0],'Duals',1);
Plot(l2);
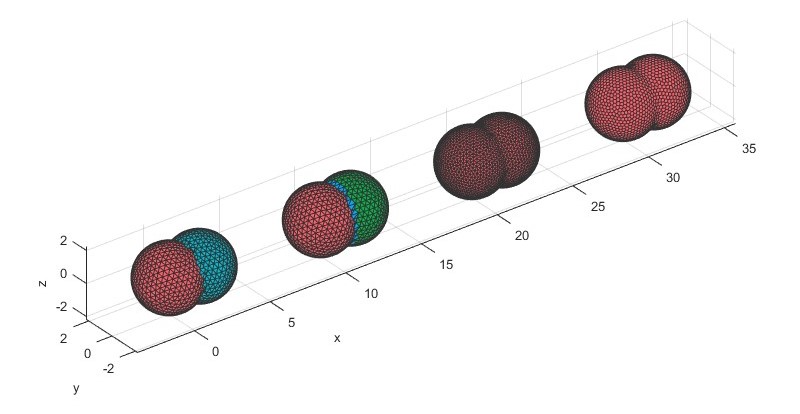
合并网格。
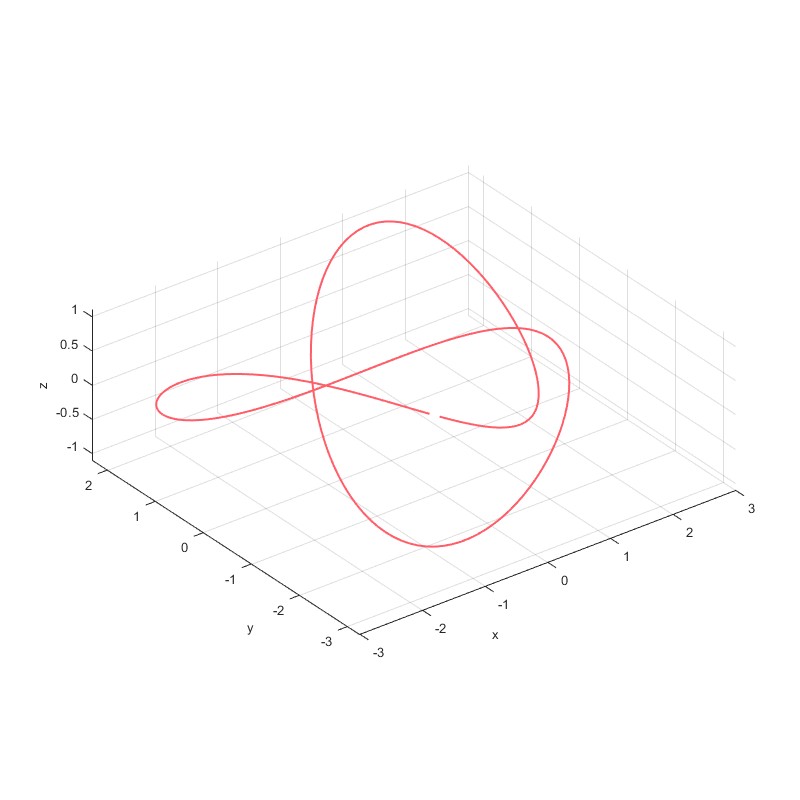
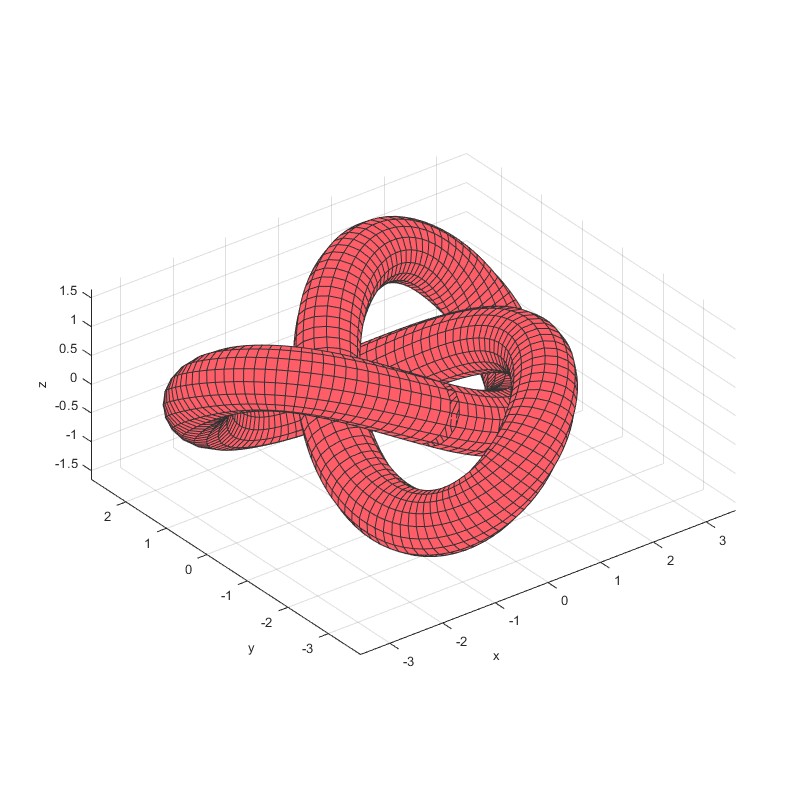
Curve to Mesh (Flag=15)
%% Constants
% number of vertices of trefoil curve
nPoints = 200;
% thickness of the 3D mesh
thickness = .5;
% number of corners around each curve vertex
nCorners = 16;
%% Create trefoil curve
% parameterisation variable
t = linspace(0, 2*pi, nPoints + 1);
t(end) = [];
% trefoil curve coordinates
curve(:,1) = sin(t) + 2 * sin(2 * t);
curve(:,2) = cos(t) - 2 * cos(2 * t);
curve(:,3) = -sin(3 * t);
l1=Layer('Layer1');
l1=AddCurve(l1,curve);
Plot(l1);
l1=Curve2Mesh(l1,1,thickness,nCorners);
Plot(l1);
曲线生成网格。
 |  |
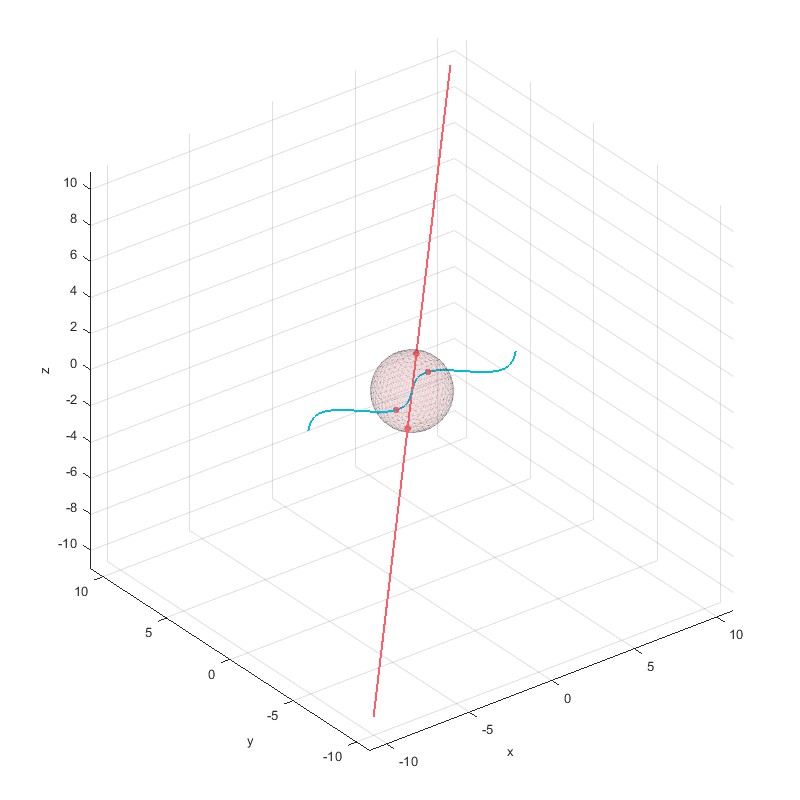
Line Mesh intersections (Flag=16)
% Sphere Mesh
numRefineStepsSphere=3;
sphereRadius=2;
mm=Mesh('Demo Sphere Mesh');
mm=MeshSphere(mm,numRefineStepsSphere,sphereRadius);
mm=Mesh3D(mm);
l1=Layer('Layer1');
l1=AddElement(l1,mm);
Plot(l1);
% Curve
curve(:,1)=[-10;-1;1;10];
curve(:,2)=[-10;-1;1;10];
curve(:,3)=[-10;-1;1;10];
l1=AddCurve(l1,curve);
t = linspace(-2*pi, 2*pi, 200);
curve1(:,1) = t';
curve1(:,2)=sin(t');
curve1(:,3)=zeros(200,1);
l1=AddCurve(l1,curve1);
Plot(l1);
l1=IntersectCurveMesh(l1,[1;2],1);
Plot(l1,'face_alpha',0.1,'edge_alpha',0.1);
线与网格的交点。
Project points to plane (Flag=17)
l1=Layer('Layer1');
pos=[0,0,0];
vec=[1,0,0];
l1=AddPlane(l1,pos,vec);
pos=[0,0,0];
vec=[1,1,0];
l1=AddPlane(l1,pos,vec);
P=-5+10*rand(10,3);
l1=AddPoint(l1,P);
Plot(l1,'planescale',5);
l1=ProjectPointPlane(l1,1,1);
l1=ProjectPointPlane(l1,1,2);
Plot(l1,'planescale',5);
将点投影到平面。

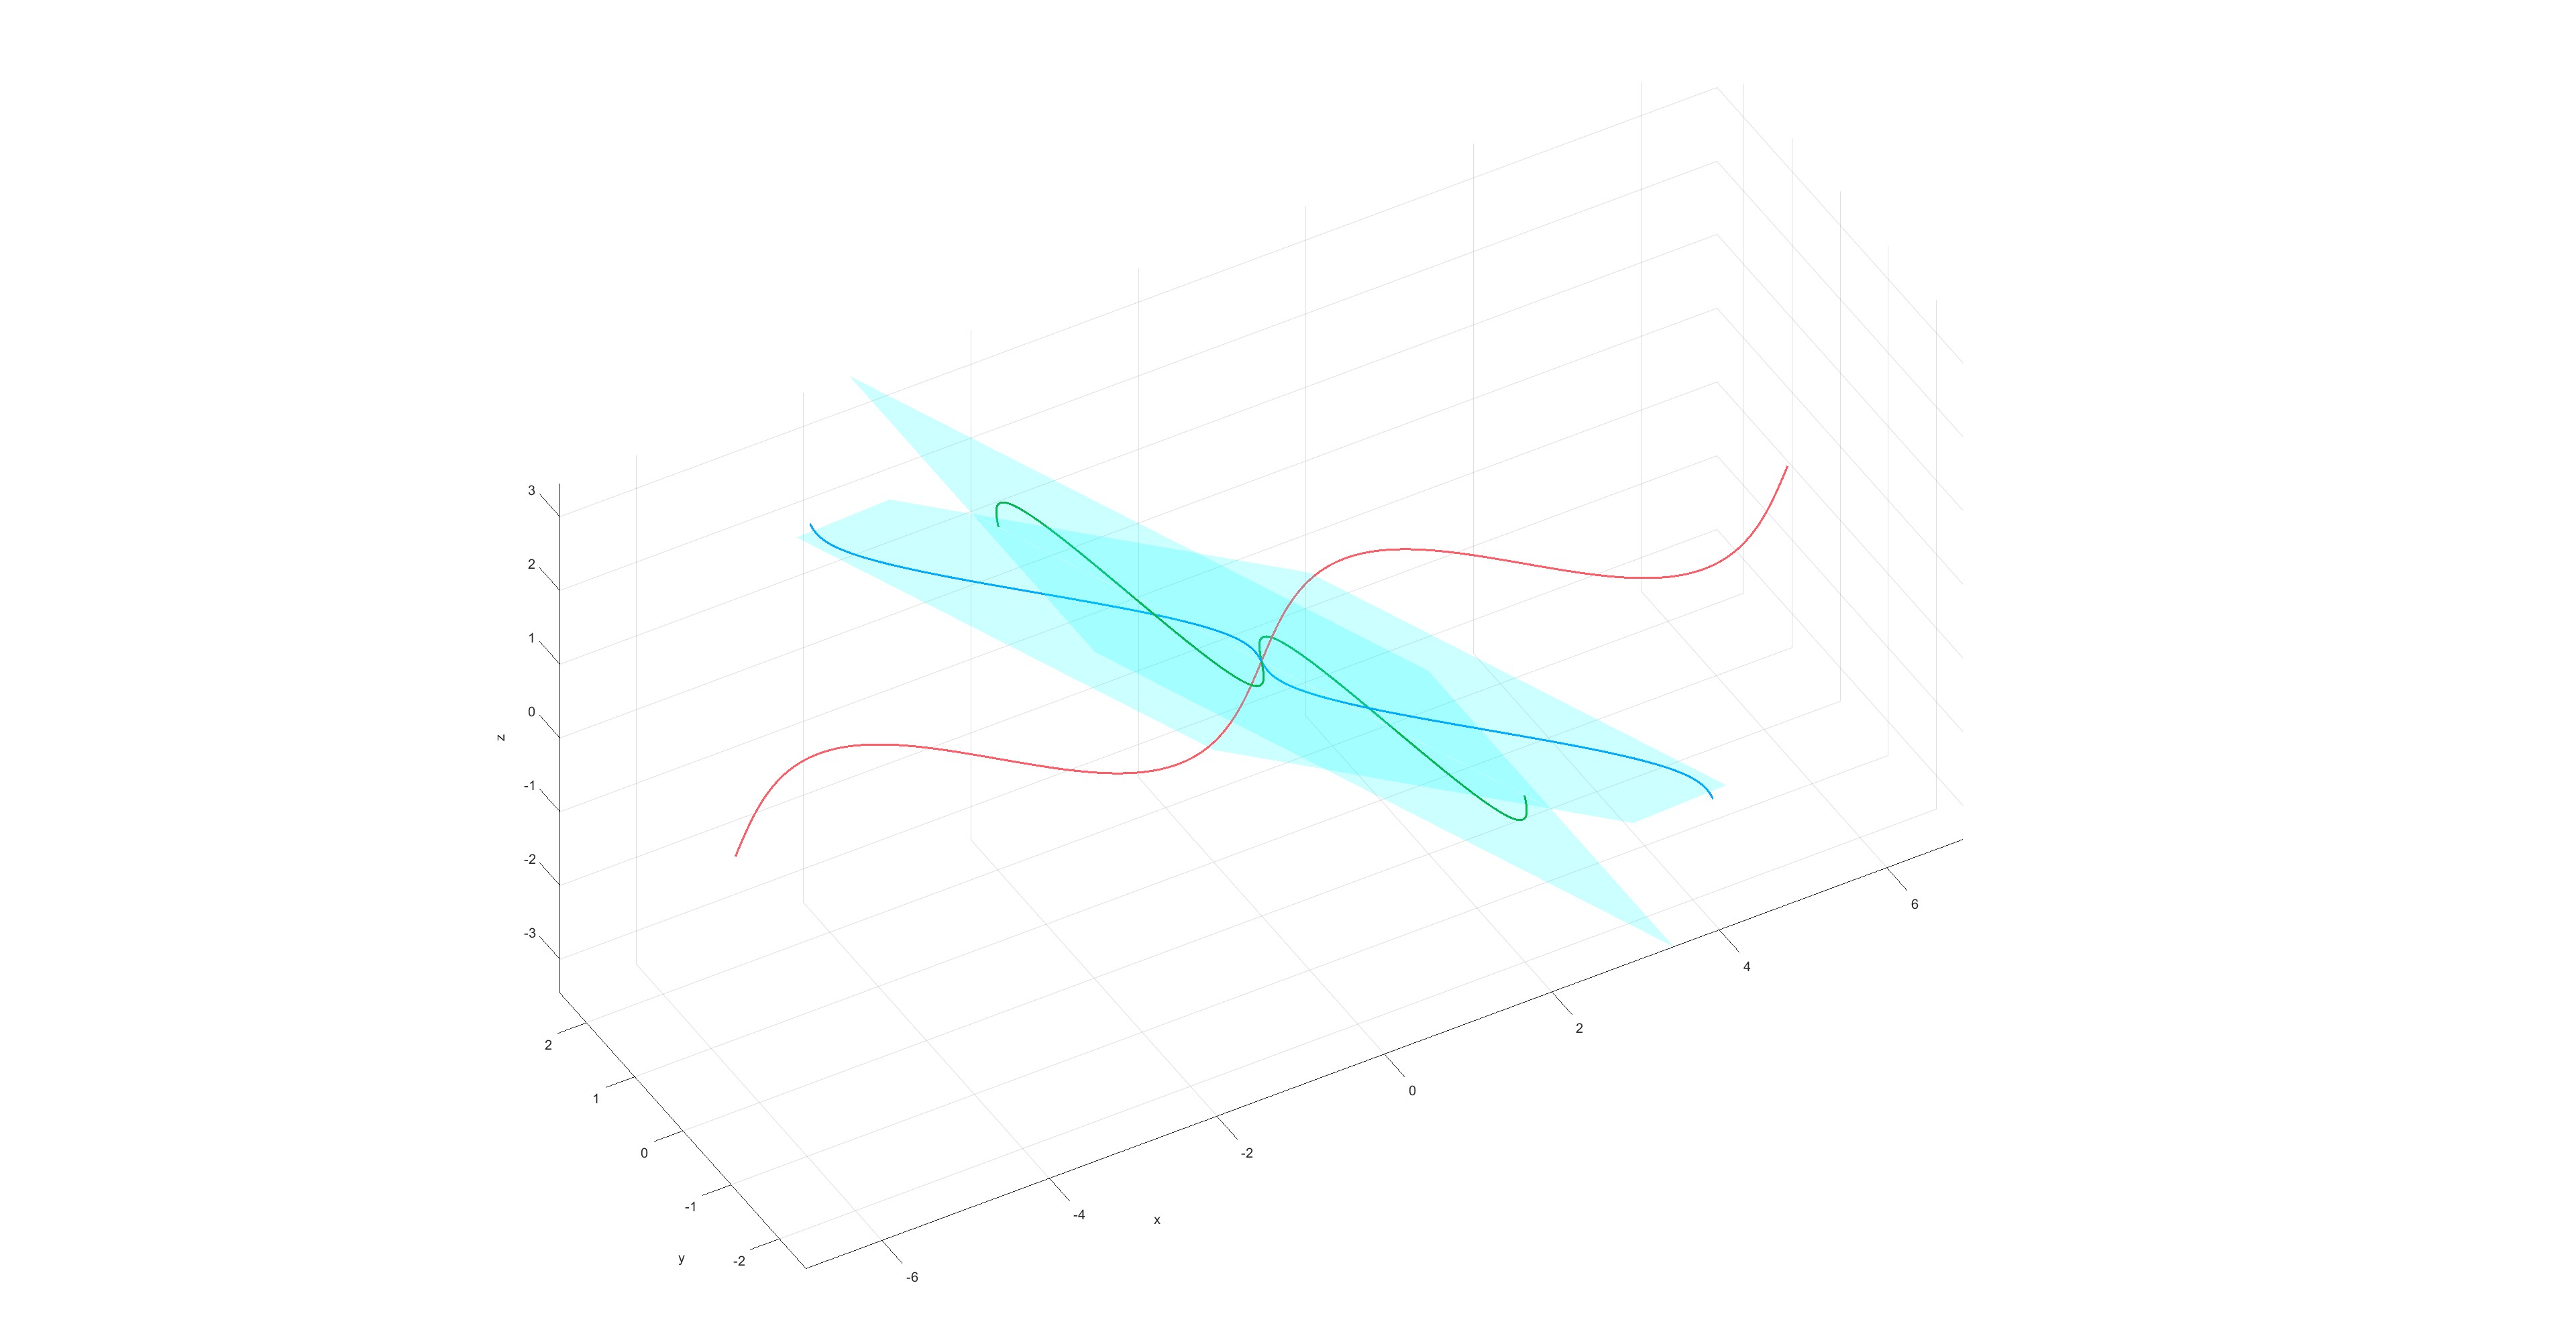
Project curves to plane (Flag=18)
l1=Layer('Layer1');
pos=[0,0,0];
vec=[1,0,1];
l1=AddPlane(l1,pos,vec);
pos=[0,0,0];
vec=[1,1,1];
l1=AddPlane(l1,pos,vec);
t = linspace(-2*pi, 2*pi, 200);
curve1(:,1) = t';
curve1(:,2)=sin(t');
curve1(:,3)=zeros(200,1);
l1=AddCurve(l1,curve1);
Plot(l1,'planescale',5);
l1=ProjectCurvePlane(l1,1,1);
l1=ProjectCurvePlane(l1,1,2);
Plot(l1,'planescale',5);
曲线投影到平面
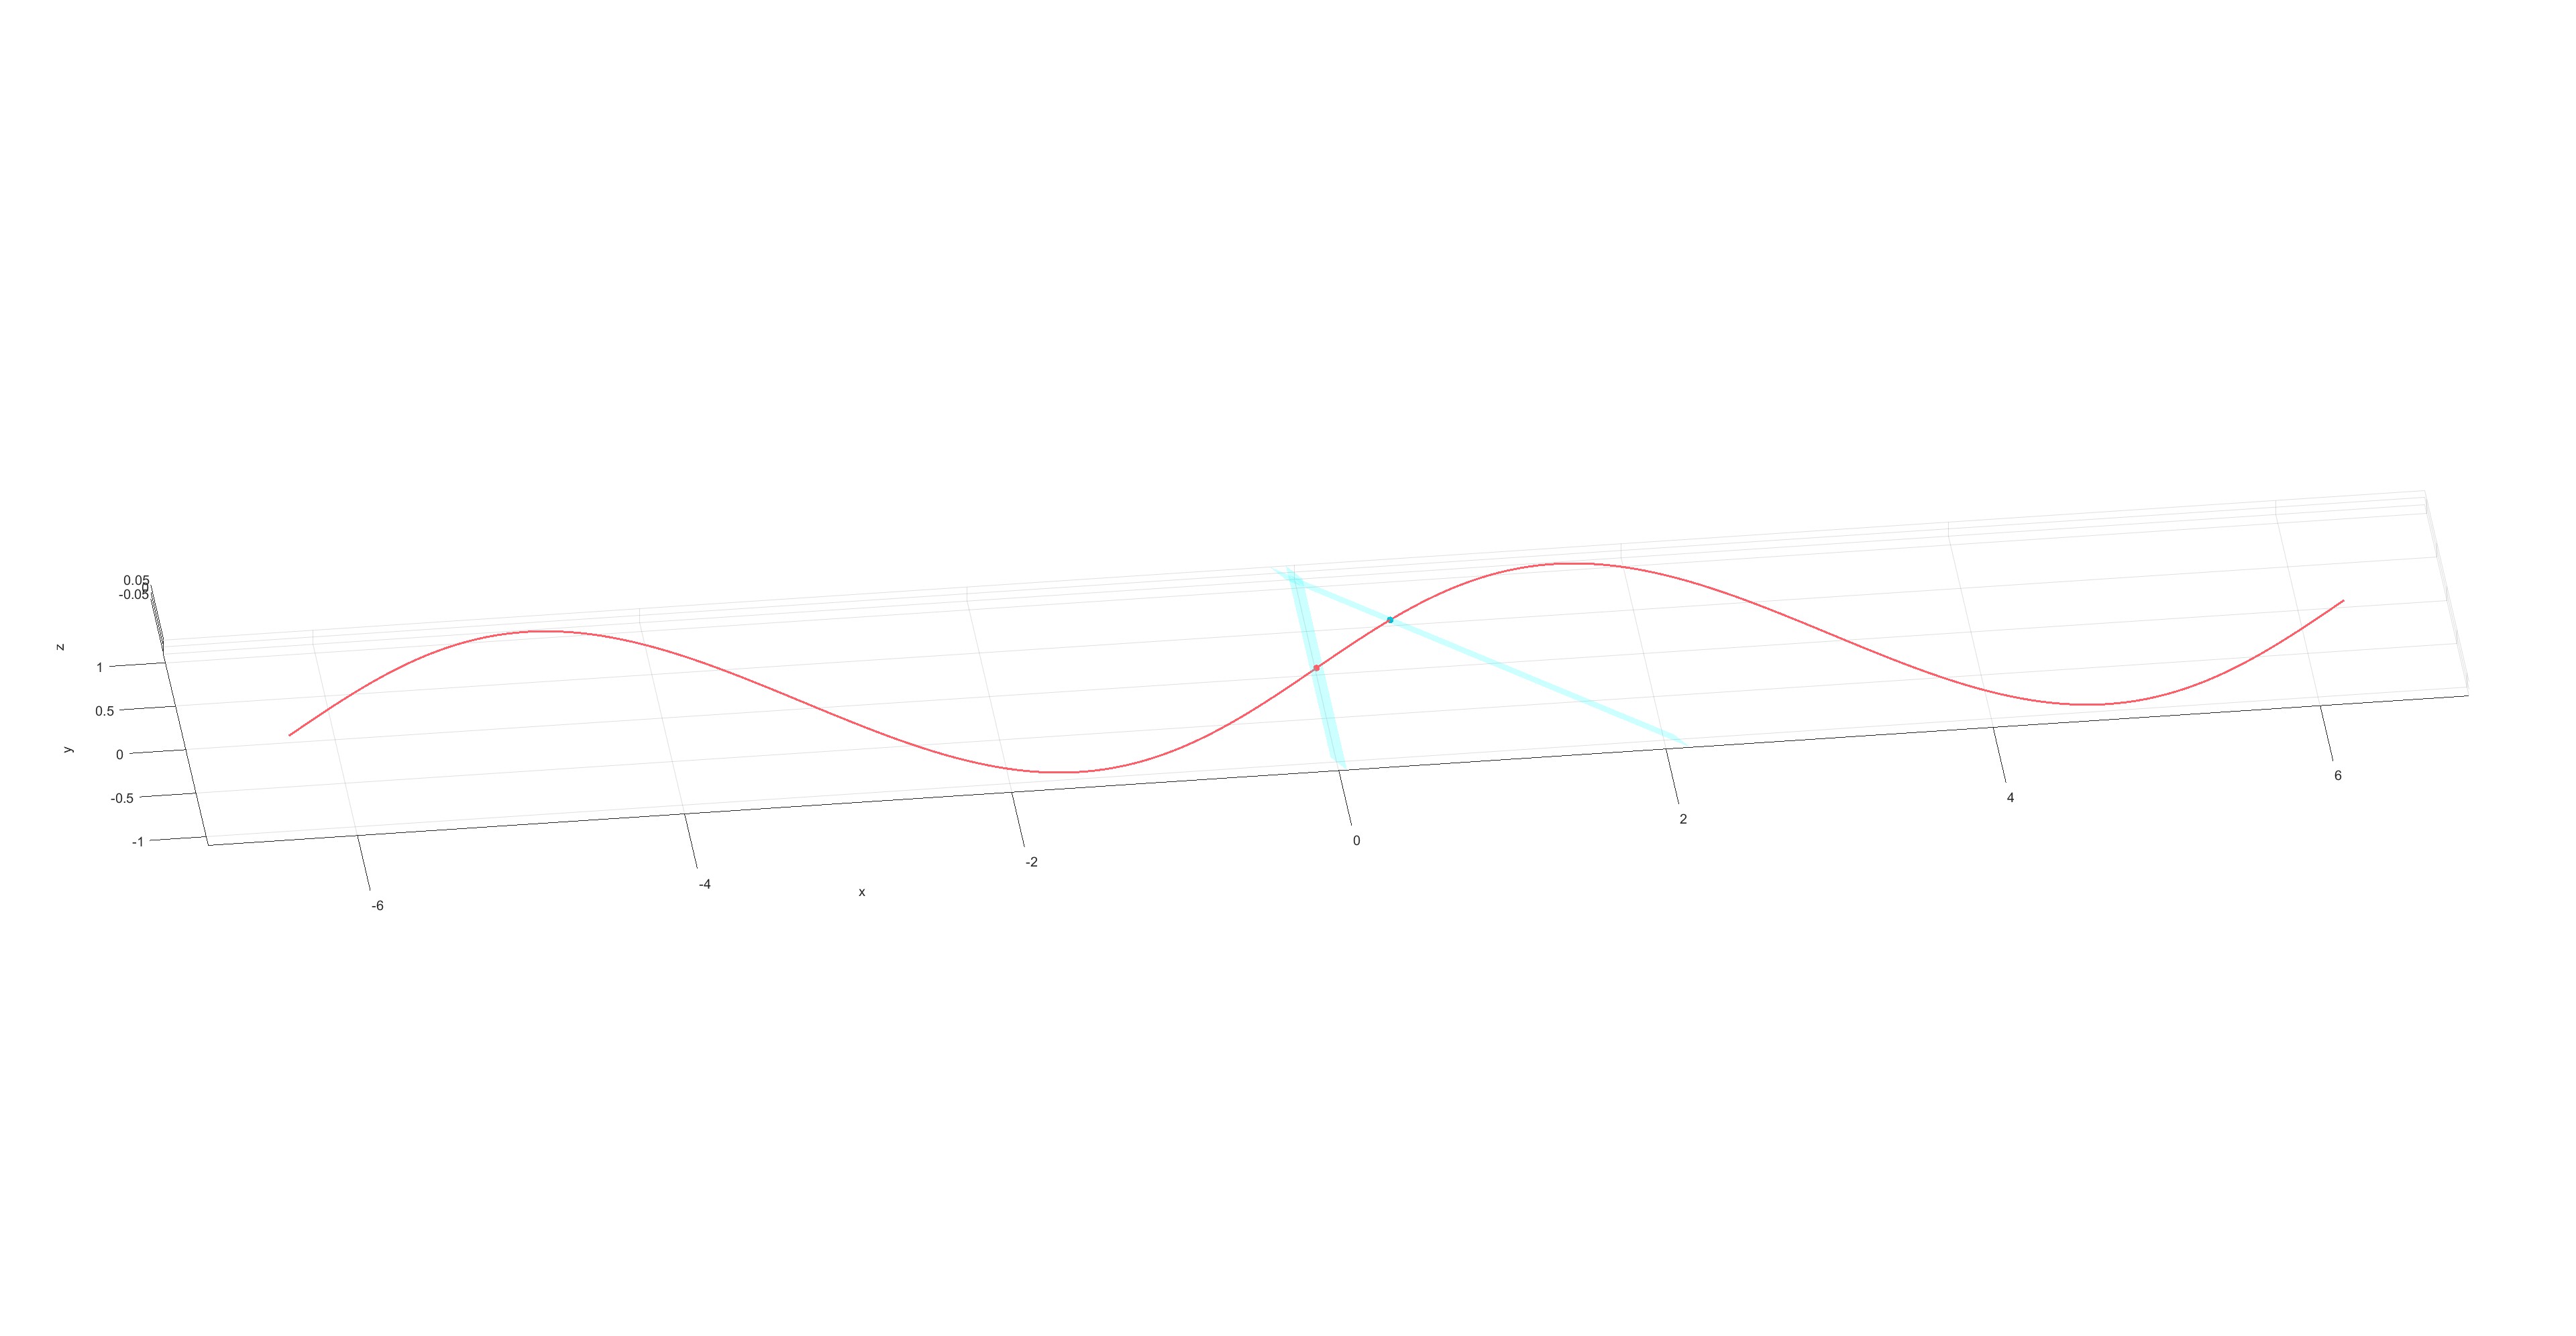
Line Plane intersections (Flag=19)
l1=Layer('Layer1');
pos=[0,0,0];
vec=[1,0,1];
l1=AddPlane(l1,pos,vec);
pos=[1,0,0];
vec=[1,1,1];
l1=AddPlane(l1,pos,vec);
t = linspace(-2*pi, 2*pi, 200);
curve1(:,1) = t';
curve1(:,2)=sin(t');
curve1(:,3)=zeros(200,1);
l1=AddCurve(l1,curve1);
Plot(l1,'planescale',5);
l1=IntersectCurvePlane(l1,1,1);
l1=IntersectCurvePlane(l1,1,2);
Plot(l1,'planescale',5);
曲线与平面交点。
Scale (Flag=20)
l1=Layer('Layer1');
l1=LoadMsh(l1,'bunny.msh');
Plot(l1);
l1=Scale(l1,0.5,'Meshes',1,'new',1);
Plot(l1,'face_alpha',0.5);
缩放网格。
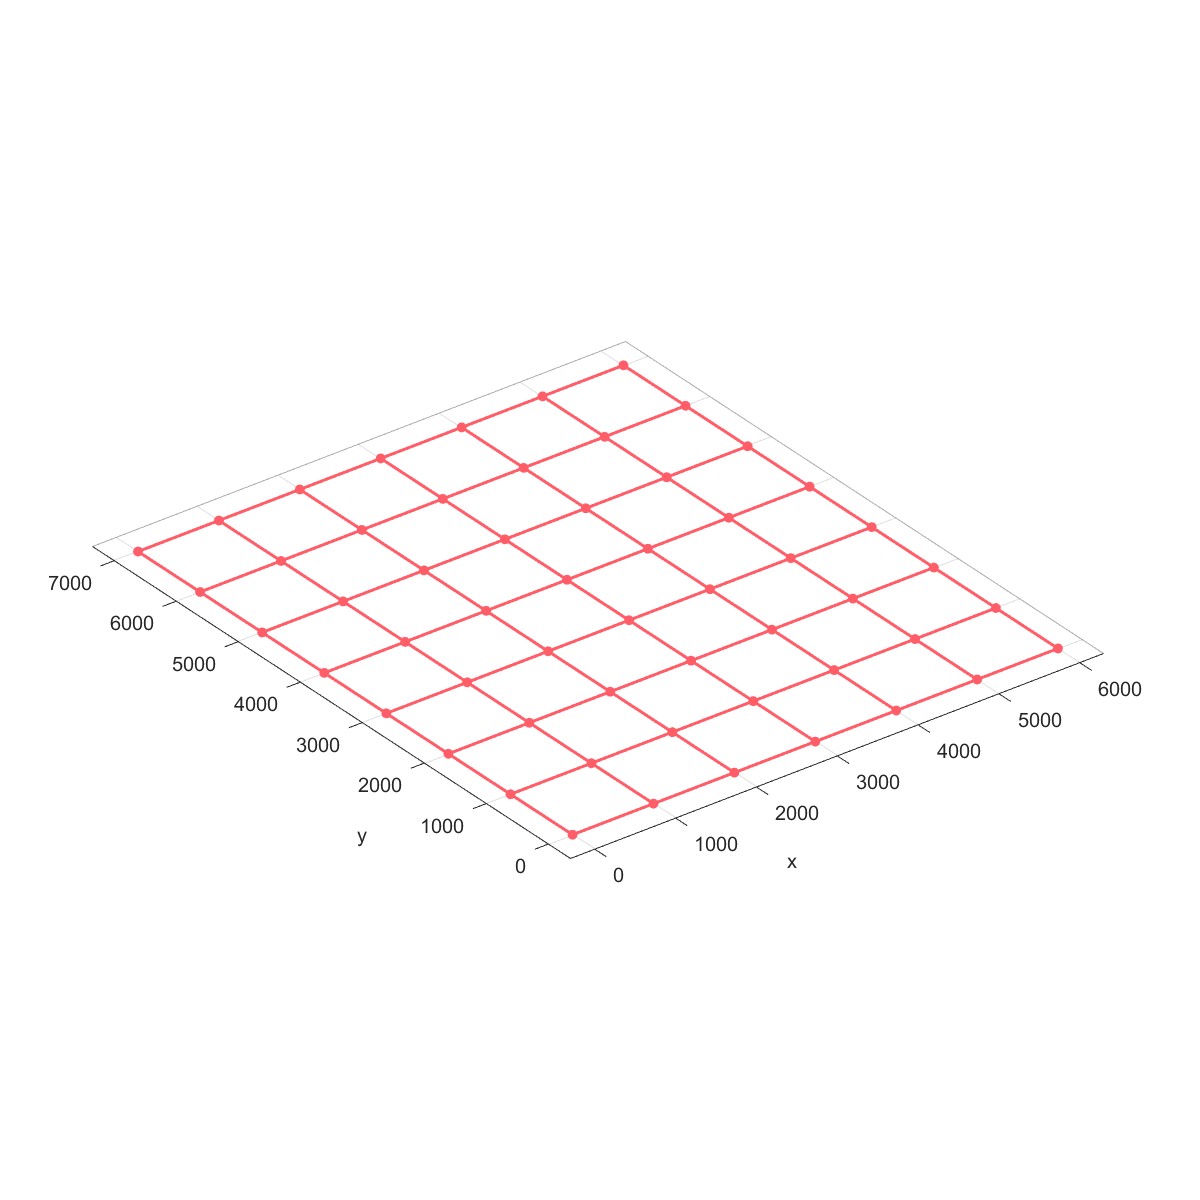
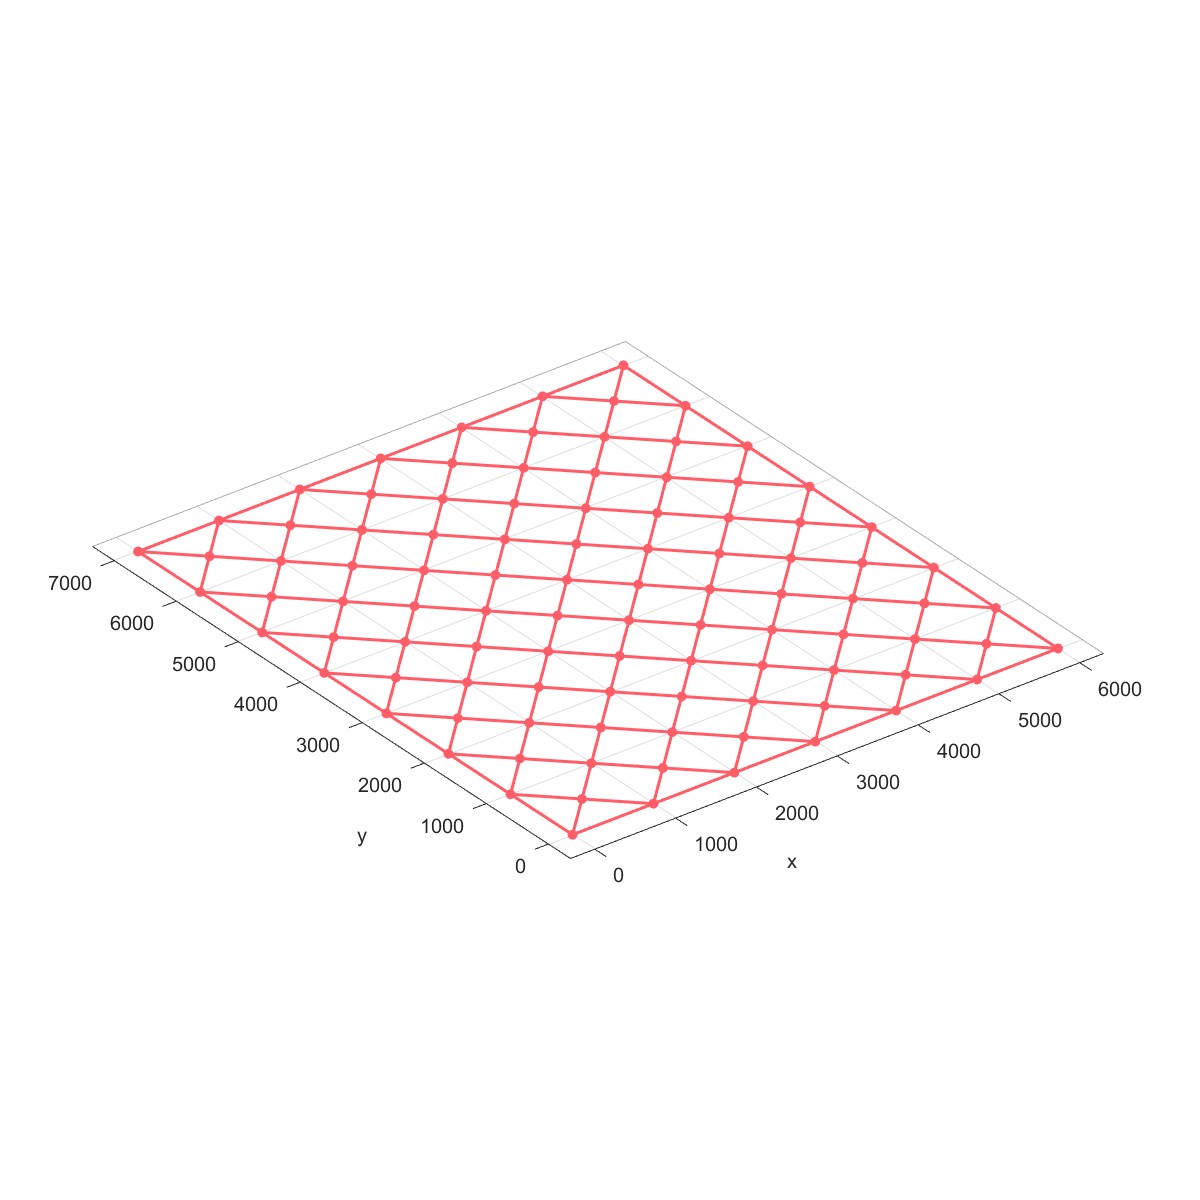
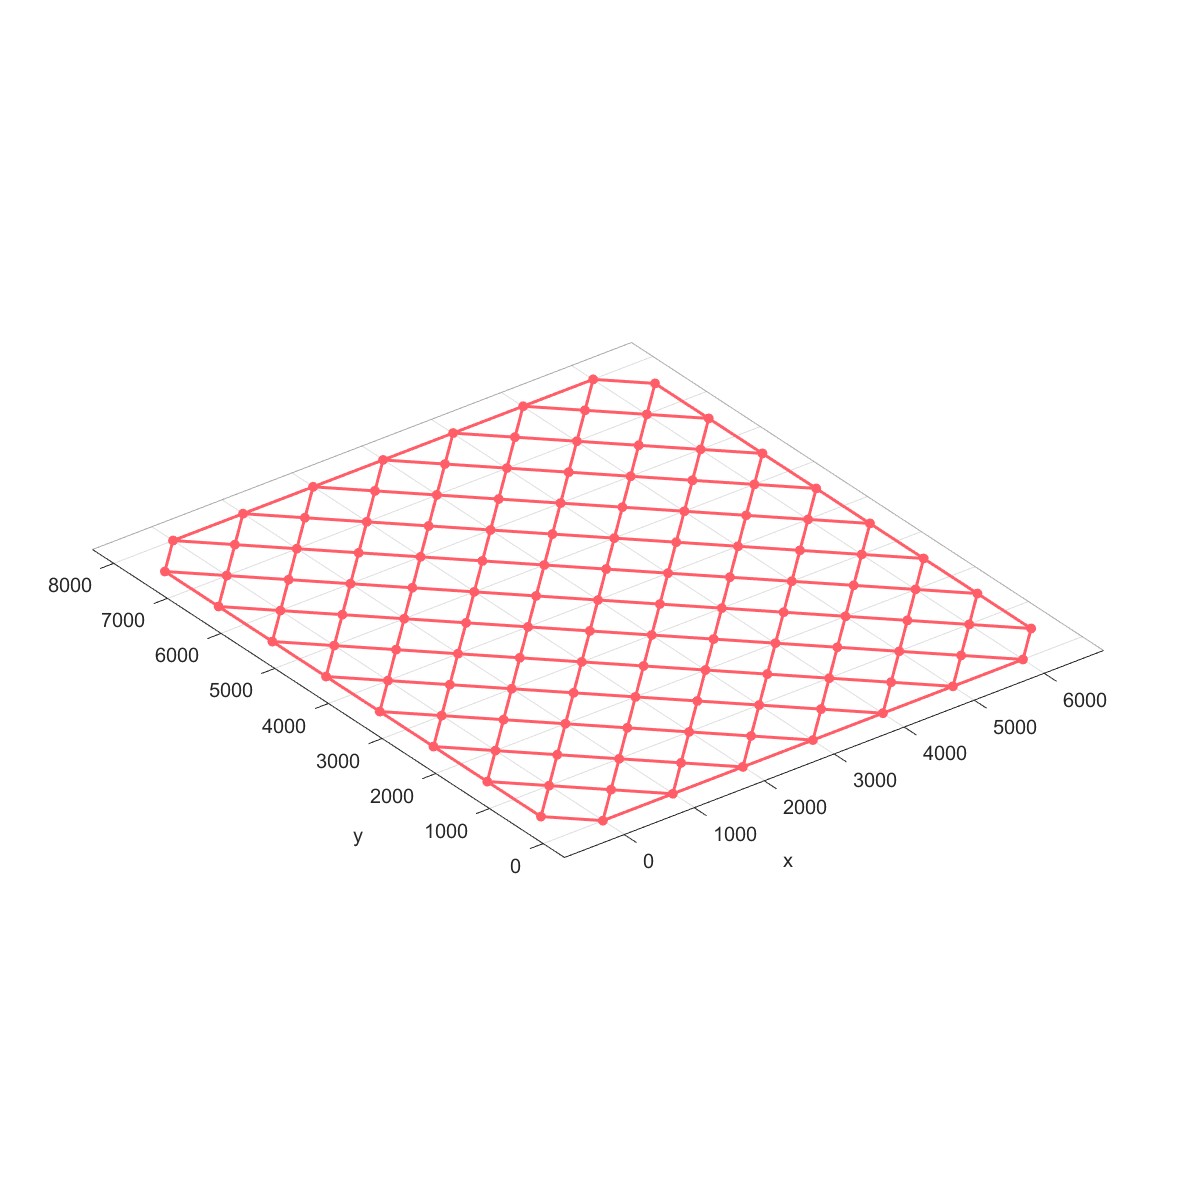
Add Grid (Flag=21)
l1=Layer('Layer1');
l1=AddGrid(l1,1000,1000,7,8);
Plot(l1);
l2=Layer('Layer2');
l2=AddGrid(l2,1000,1000,7,8,'Type',2);
Plot(l2);
l3=Layer('Layer3');
l3=AddGrid(l3,1000,1000,7,8,'Type',4);
Plot(l3);
 |  |
Add ShellGrid (Flag=22)
l1=Layer('Layer1');
l1=AddShellGrid(l1,6800,30000,24,6);
Plot(l1);
l2=Layer('Layer2');
l2=AddShellGrid(l2,6800,30000,24,6,'Type',2);
Plot(l2);
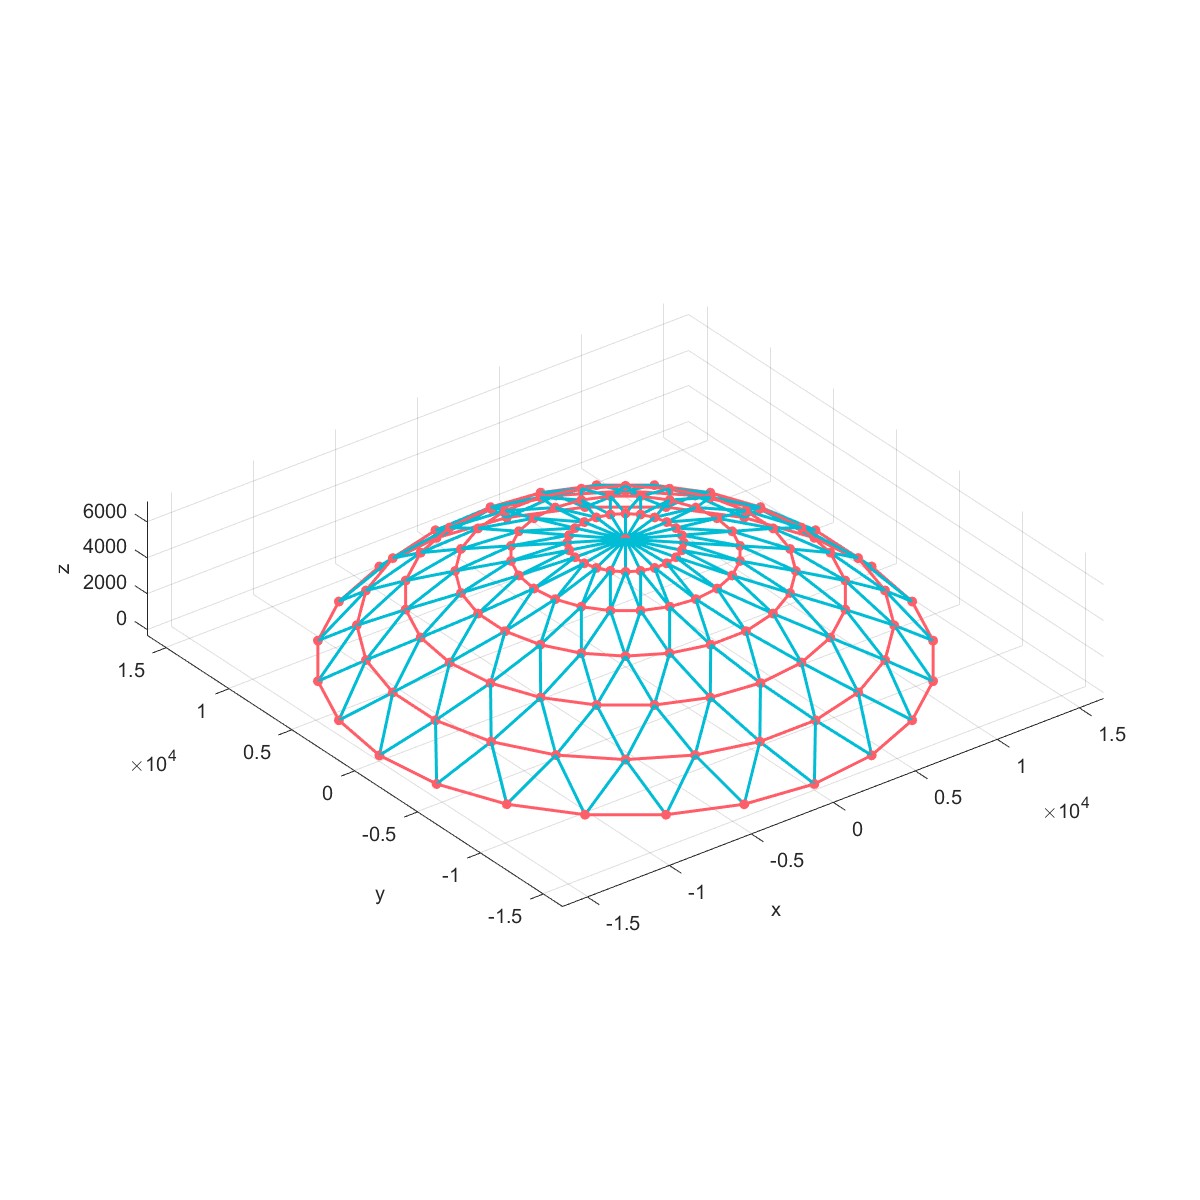
l3=Layer('Layer3');
l3=AddShellGrid(l3,6800,30000,24,6,'Type',3);
Plot(l3);
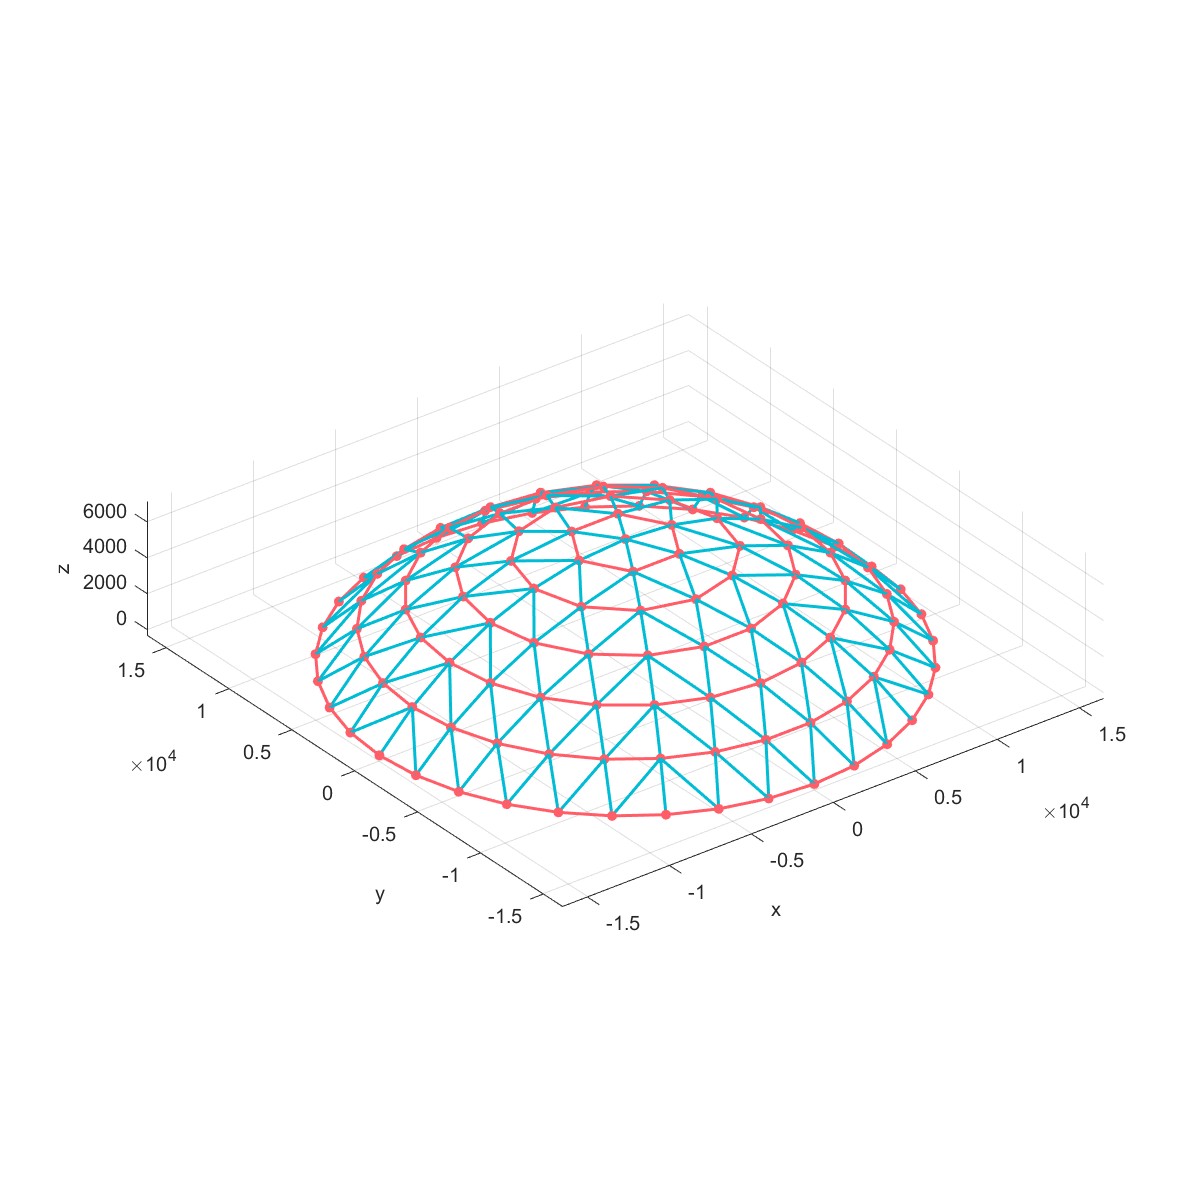
l4=Layer('Layer4');
l4=AddShellGrid(l4,6800,30000,6,6,'Type',4);
Plot(l4);
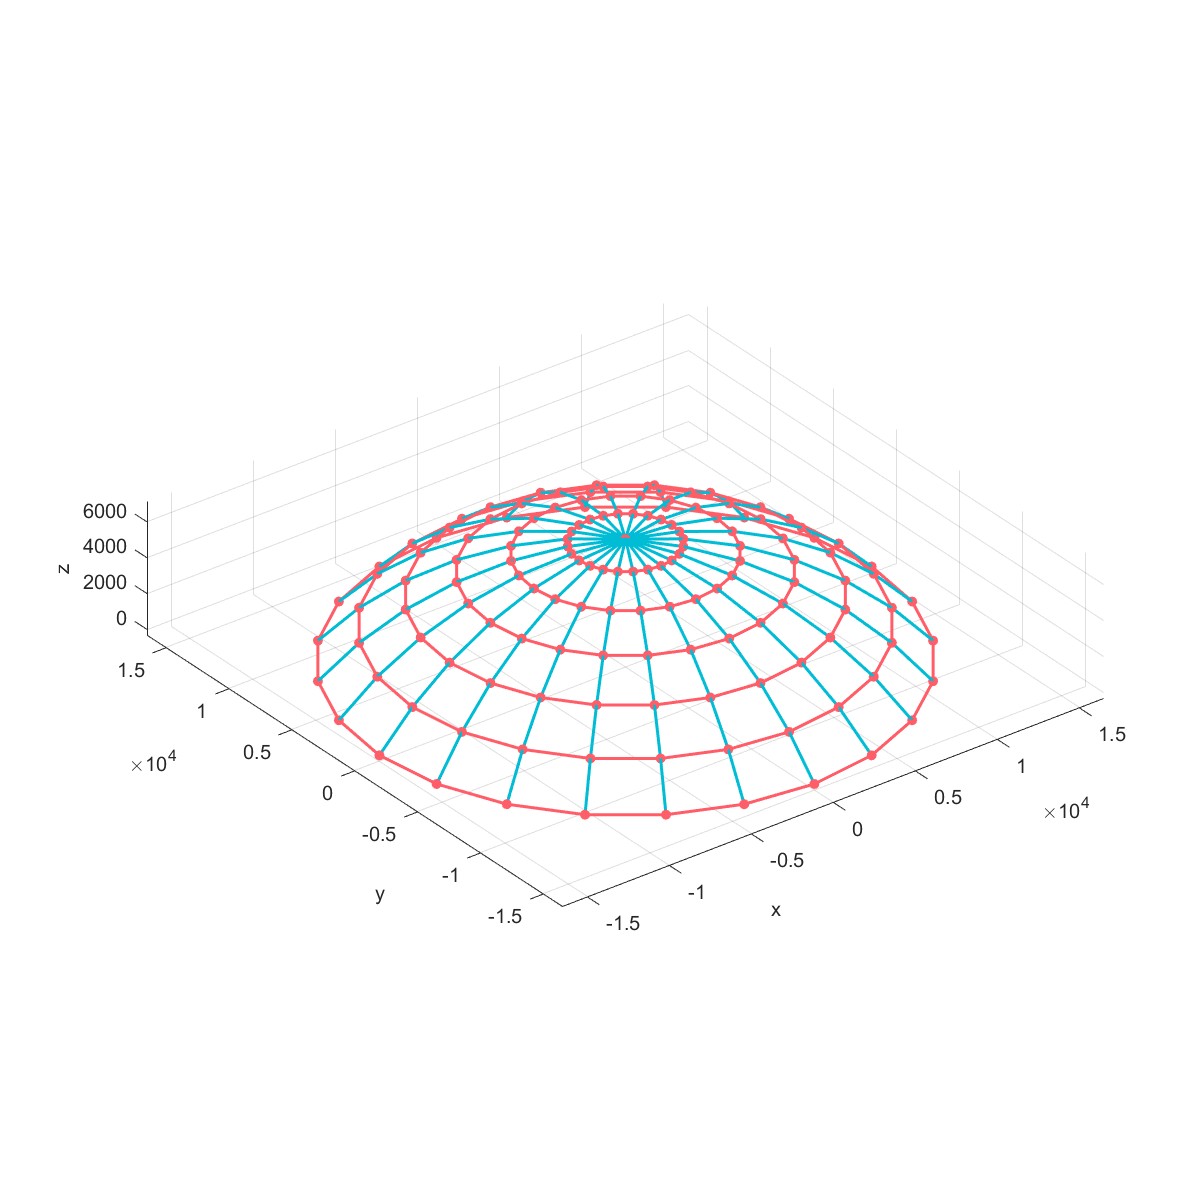 | 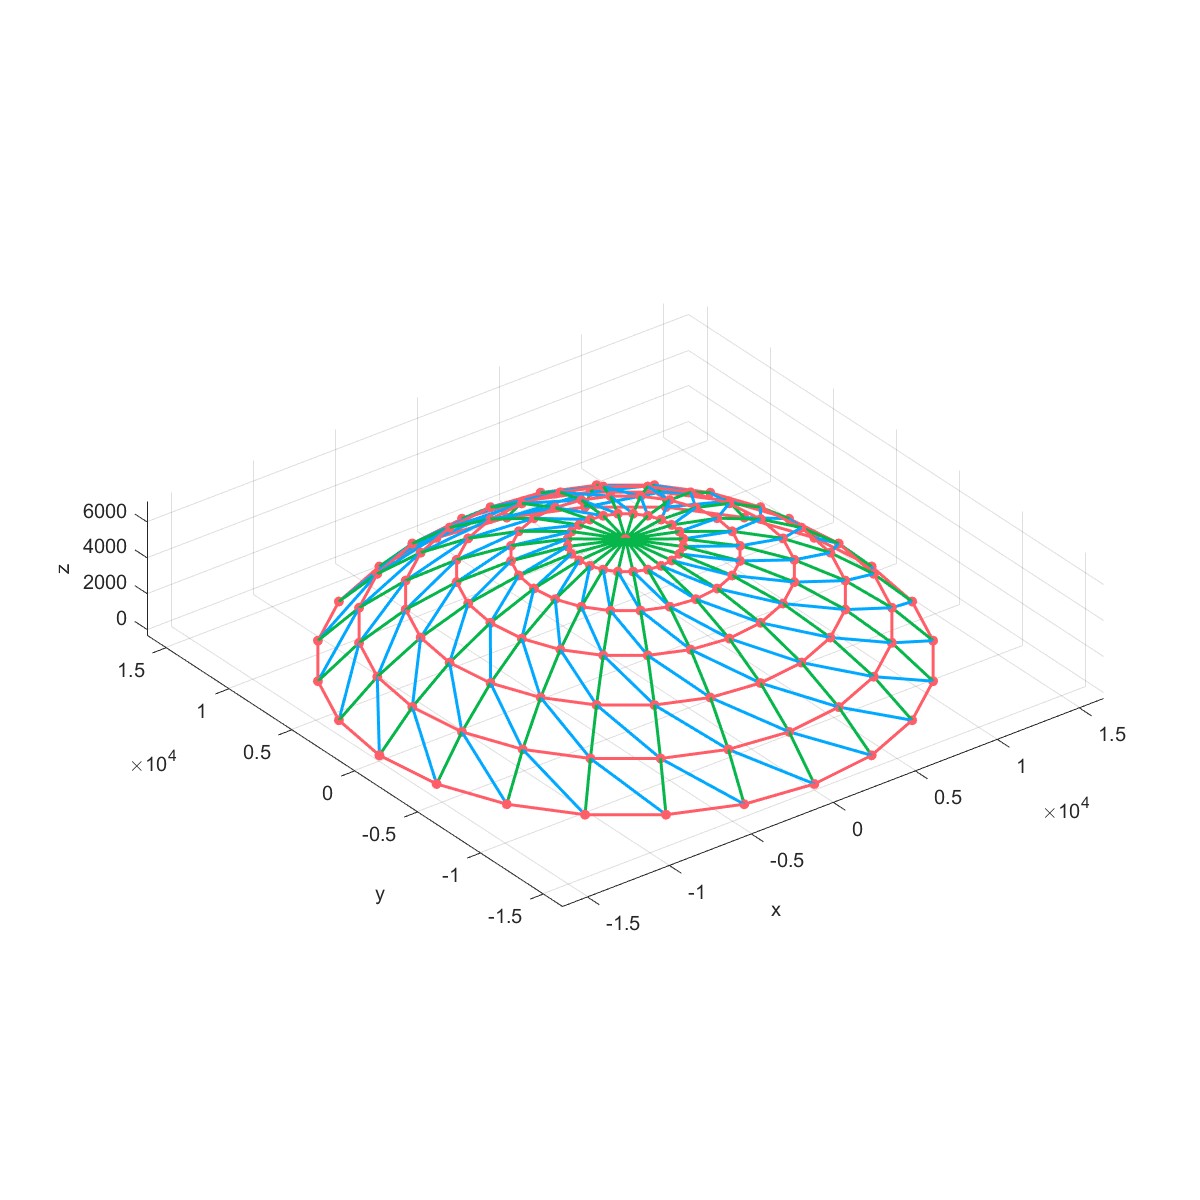 |
 |  |
Add Line object (Flag=23)
%% AddLine
a=Point('Point Ass1');
a=AddPoint(a,[0;5],[0;4],[0;2]);
b=Line('Line Ass1');
b=AddLine(b,a,1);
%% AddCurve
P = [0.5 1.5 4.5 3.0 7.5 6.0 8.5;
    3.0 5.5 5.5 1.5 1.5 4.0 4.5;
    0.0 0.0 0.0 0.0 0.0 0.0 0.0];
a=AddPoint(a,P(1,:)',P(2,:)',P(3,:)');
b=AddCurve(b,a,2);
%% AddCircle
a=AddPoint(a,0,0,5);
b=AddCircle(b,2.5,a,3);
b=AddCircle(b,3,a,3,'rot',[45,45,45]);
%% AddEllipse
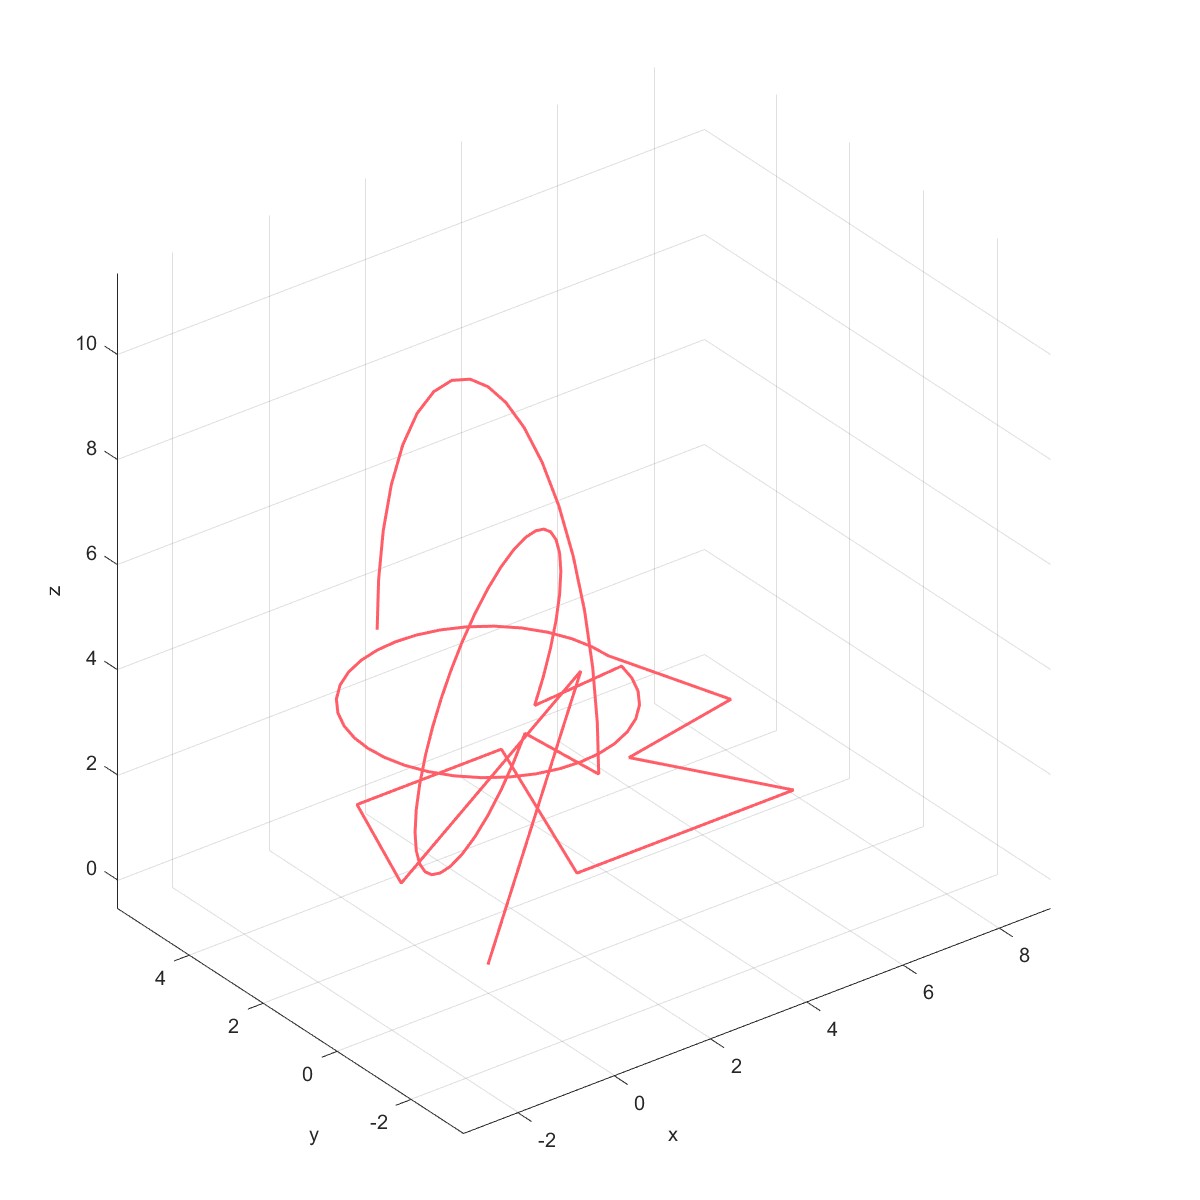
b=AddEllipse(b,6,3,a,3,'rot',[0,-90,0],'sang',-90,'ang',180);
Plot(b,'clabel',1,'styles',{'-'});
l1=Layer('Layer1');
l1=AddElement(l1,b);
Plot(l1);
CheatTable
| Name | Varargin | Description |
|---|---|---|
| AddCurve(obj,P) | Add curves | |
| AddElement(obj,inputobj) | ‘Transform’,’Compress’ | Add objects |
| AddGrid(obj,lx,ly,nx,ny) | ‘Type’ | Add grids |
| AddHeight(obj,Num,Height) | ‘coor’,fun’,’new’ | Add Mesh Height |
| AddMesh(obj,meshinput) | Add Mesh | |
| AddPlane(obj,P0,N) | Add plane | |
| AddPoint(obj,P) | Add points | |
| AddShellGrid(obj,f,L,kn,nx) | ‘Type’ | Add shell grid |
| BoundingBox(obj,pointsNum) | Bound box of points | |
| CalculateCurvature(obj,LineNo) | Calculate curvature of curves | |
| CombineMeshPair(obj, meshno1,meshno2) |
‘remesh’,’reverse’ | Combine mesh pair |
| ComputeGeometryDual(obj,Num) | Compute geometry dual | |
| ConnectPoints(obj,source,tar, point1,point2) |
Connect points | |
| Curve2Mesh(obj,lineno, thickness,nCorners) |
‘close’ | Use curve to generate mesh |
| CurveClockwise(obj,LineNum) | Check curve clockwise | |
| CurveOffset(obj,LinesNum,dis) | Curve offset | |
| Extrude2Face(obj,nn,depth) | ‘numSteps’,’pointSpacing’, ‘patchType’,’dir’,’closeLoopOpt’ |
Extrude curve to face |
| FindBoundaryCurve(obj,MeshNum) | ‘color’ | Find mesh boundary curve |
| FindMeshBoundary(obj,MeshNum) | ‘color’ | Find mesh boundary edge |
| GetNDuals(obj) | Get total number of duals | |
| GetNLines(obj) | Get total number of lines | |
| GetNMeshes(obj) | Get total number of meshes | |
| GetNMeshoutput(obj) | Get total number of meshoutput | |
| GetNPlanes(obj) | Get total number of planes | |
| GetNPoints(obj) | Get total number of point groups | |
| IntersectCurveMesh(obj,lineno,meshno) | ‘eps’ | Intersect curves and meshes |
| IntersectCurvePlane(obj,lineno,planeno) | Intersect curves and planes | |
| IntersectMeshMesh(obj,meshno1,meshno2) | Intersect meshes and meshes | |
| IntersectPlaneMesh(obj,planeno,meshno) | Intersect meshes and planes | |
| LoadMsh(obj,name) | Load msh file | |
| LoftLinear(obj,start,last) | ‘numSteps’,’closeLoopOpt’, ‘patchType’,’untwistOpt’, |
Create a loft between the two input curves |
| Meshoutput(obj) | ‘Lines’,’Compress’,’Dtol’ | Output Layer lines to mesh |
| Move(obj,dis) | ‘Meshes’,’Points’,’Lines’, ‘Surfaces’,’Duals’,’new’ |
Move object |
| ObjRead(obj,filename) | Read object file | |
| Plot(obj) | ‘group’,’pointson’,’lineson’, ‘mesheson’,’dualson’,’planeson’, ‘linesmerge’,’surfaceson’, ‘face_normal’,’face_alpha’ ,’edge_alpha’,’xlim’,’ylim’, ,’zlim’,’edgecolor’,’planescale’, ‘View’,’equal’,’grid’,’axe’ |
Plot Layer object |
| Plot2(obj) | Plot Layer object in Paraview | |
| ProjectCurvePlane(obj,lineno,planeno) | Project curves to planes | |
| ProjectPointPlane(obj,pointno,planeno) | Project points to planes | |
| RebuildCurve(obj,LinesNum,n) | ‘interpPar’,’closeLoopOpt’, ‘spacingFlag’, |
Rebuild curve |
| Remesh(obj,MeshNo,opt) | Remesh the mesh | |
| Rotate(obj,angle) | ‘Meshes’,’Points’,’Lines’, ‘Surfaces’,’Duals’,’new’, ‘origin’ |
Rotate the object |
| Scale(obj,factor) | ‘Meshes’,’Points’,’Lines’, ‘Surfaces’,’Duals’,’new’, ‘origin’ |
Scale the object |
| STLRead(obj,filename) | Read stl file | |
| Subtract(obj,basemeshno,meshno) | Subtract meshes | |
| SweepLoft(obj,LineNum,guideline) | ‘PointSpacing’,’Nseg’, ‘Smooth’ |
Sweep loft of lines |
| Tri2Dual(obj,meshno) | Convert Tri mesh to Dual mesh | |
| Union(obj,meshno) | Union the meshes | |
| VTKWriteLines(obj) | Write VTK file of lines | |
| VTKWriteMeshes(obj) | Write VTK file of meshes | |
| VTKWritePoints(obj) | Write VTK file of |
参考文献
[1] https://www.mathworks.com/matlabcentral/fileexchange/48208-gibboncode-gibbon?s_tid=srchtitle
[2] https://www.gibboncode.org
[3] https://www.sintef.no/projectweb/mrst/
本网站基于Hexo 3-Hexz主题生成。如需转载请标注来源,如有错误请批评指正,欢迎邮件至 392176462@qq.com