Line2D
介绍
Line2D类是用来生成2D的曲线,主要参考了FEM19$^{[1][2][3][4]}$开源项目。
关键曲线的参数:
CT: 曲线类型(1:直线 2:圆弧 3:曲线 4:椭圆弧 5:贝塞尔6:B样条7:样条8:抛物线9:双曲线10:Nurb曲线)
CIX: 曲线编号
C : 曲线数据
案例
Add different curves (Flag=1)
%% AddLine
x1=[-1;1];
y1=[-3;-3];
a=Point2D('Point Ass1');
a=AddPoint(a,x1,y1);
b=Line2D('Line Ass1');
b=AddLine(b,a,1);
Plot(b,'clabel',1,'styles',{'-'});
%% AddCurve
x2=[0;0.3;-0.3;0];
y2=[0;-1;-1;0];
a=AddPoint(a,x2,y2);
b=AddCurve(b,a,2);
Plot(b,'clabel',1,'styles',{'-'},'equal',0);
%% AddCircle
x3=-3;y3=2;
x4=3;y4=2;
x5=0;y5=0;
a=AddPoint(a,x3,y3);
a=AddPoint(a,x4,y4);
a=AddPoint(a,x5,y5);
b=AddCircle(b,0.5,a,3);
b=AddCircle(b,0.5,a,4);
b=AddCircle(b,5,a,5);
Plot(b,'clabel',1,'styles',{'-'},'equal',1);
%% AddEllipse
x6=0;y6=-3;
a=AddPoint(a,x6,y6);
b=AddEllipse(b,1,0.5,a,6,'rot',-90,'sang',-90,'ang',180);
Plot(b,'clabel',1,'styles',{'-'},'equal',1);
%% AddSpline
x7=[-4;-3;-2];y7=[2.5;3;2.5];
a=AddPoint(a,x7,y7);
b=AddSpline(b,1,a,7);
Plot(b,'clabel',1,'styles',{'-'},'equal',1);
%% AddBezier
x8=[4;3;2];y8=[2.5;3;2.5];
a=AddPoint(a,x8,y8);
b=AddBezier(b,a,8);
Plot(b,'clabel',1,'styles',{'-'},'equal',1);
%% AddBspline
x9=[-1.5;0;1.5];y9=[3;3.5;3];
a=AddPoint(a,x9,y9);
b=AddBspline(b,3,a,9);
Plot(b,'clabel',1,'styles',{'-'},'equal',1);
%% AddHyperbola
b1=Line2D('Line Ass2');
b1=AddHyperbola(b1, 2, 1,a,5,'t1',-1,'t2',3);
b1=AddHyperbola(b1, 1, 1,a,5,'t1',-3,'t2',3);
b1=AddHyperbola(b1, 2, 1,a,5,'rot',90,'t1',-3,'t2',3);
Plot(b1,'clabel',1,'styles',{'--'},'equal',1);
%% AddParabola
b2=Line2D('Line Ass3');
b2=AddParabola(b2, 2,a,5,'t1',-1,'t2',3);
b2=AddParabola(b2, 1,a,5,'t1',-3,'t2',3);
b2=AddParabola(b2, 2,a,5,'rot',90,'t1',-3,'t2',3);
Plot(b2,'clabel',1,'styles',{':'},'equal',1);
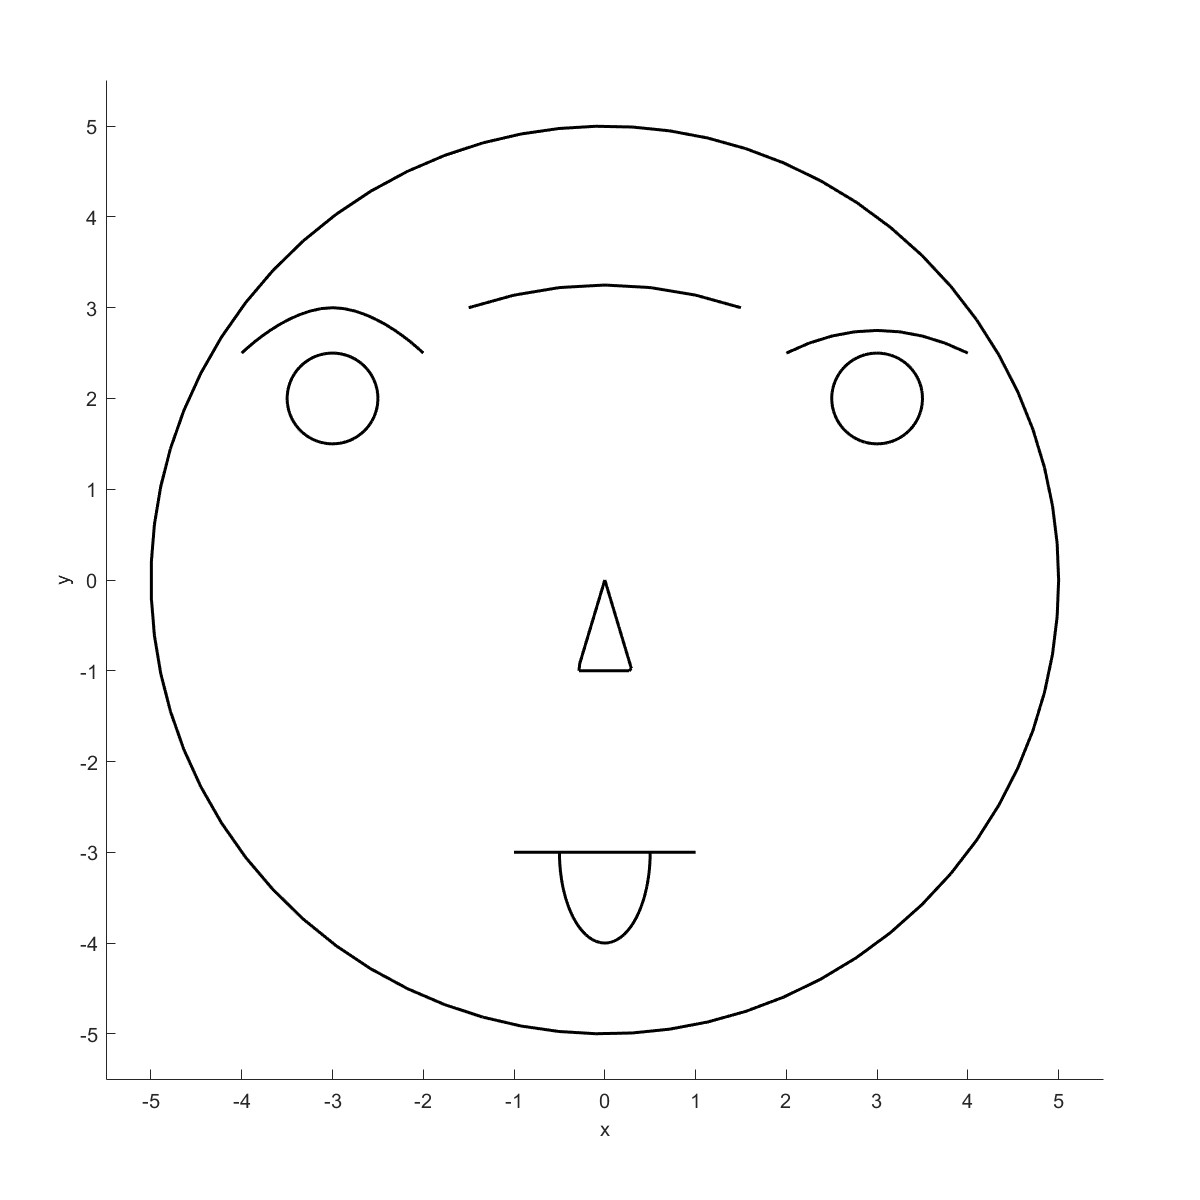
C1为直线,C2为多段的曲线,C3~C5为圆形,C6为半圆弧,C7为样条曲线,C8为贝塞尔曲线,C9为B样条

 |  |
| 双曲线 | 抛物线 |
Calculate the boundary of points (Flag=2)
Boundary用来计算点集的边界,调整松弛因子可得到不同的边界曲线。
x1=-5 + (5+5)*rand(20,1);
y1=-5 + (5+5)*rand(20,1);
x2=-5 + (5+5)*rand(20,1);
y2=-5 + (5+5)*rand(20,1);
a=Point2D('Point Ass1');
a1=Point2D('Point Ass2');
a=AddPoint(a,x1,y1);
a1=AddPoint(a1,x2,y2);
Plot(a);
b=Line2D('Line Ass1','Compress',0);
b1=Line2D('Line Ass1','Compress',0);
b=Boundary(b,a);
b=Boundary(b,a,'scale',1);
b1=Boundary(b1,a1);
b1=Boundary(b1,a1,'scale',1);
Plot(b,'map','lch','color',1);
Plot(b1,'map','lch','color',1);
L=Layer('Layer 1');
L=AddElement(L,a,'Transform',[0,0,0,0,0,0]);
L=AddElement(L,a1,'Transform',[0,0,1,0,0,0]);
L=AddElement(L,b,'Transform',[0,0,0,0,0,0]);
L=AddElement(L,b1,'Transform',[0,0,1,0,0,0]);
Plot(L,'linesmerge',1,'equal',2);
 |  |
 |  |
Draw arrow (Flag=3)
绘制线段时,可将Arrow打开,并设置箭头的形式Form.
a=Point2D('Point Ass1');
for i=1:4
x=[i-1;i-0.5];
for j=1:3
y=[j-1;j-0.5];
a=AddPoint(a,x,y);
end
end
b=Line2D('Line Ass1','Arrow',1,'Form',(1:12)');
for i=1:12
b=AddLine(b,a,i);
end
Plot(b,'equal',1)

Polygon (Flag=4)
b=Line2D('Line Ass1','Arrow',1,'Adfac',0.01);
b=AddPolygon(b,1,10,'sang',90,'close',0);
b=Shift(b,1,2);
Plot(b,'equal',1,'crv',1);
Plot(b,'equal',1,'crv',2);
AddPolygon绘制多边形,打开close可得到封闭的多边形。

运用shift函数可以转换连接点位置,比如Shift(obj,1,2)代表将曲线1端点移动两个位置,得到效果如下。

AddStar (Flag=5)
b=Line2D('Line Ass1');
b=AddStar(b,51,1,'sang',90,'close',1,'anglelimit',0);
Plot(b,'equal',1,'base_size',0.1);
AddStar可以列出n角星绘制的所有可能,下图是一个51角星所有绘制方法合成的一张图。

DeleteCurve (Flag=6)
b=Line2D('Line Ass1');
b=AddStar(b,11,1,'sang',90,'close',1);
Plot(b,'equal',1,'base_size',0.1);
b=DeleteCurve(b,1);
Plot(b,'equal',1,'base_size',0.1);
绘制11角星的所有可能,接下来把第一种方法删除,采用DeleteCurve来删除指定的曲线。
 |  |
Bounding box (Flag=7)
points=rand(100,2);
a=Point2D('Point Ass1');
a=AddPoint(a,points(:,1),points(:,2));
b=Line2D('Line Ass1');
b=BoundingBox(b,a);
L=Layer('Layer 1');
L=AddElement(L,a,'Transform',[0,0,0,0,0,0]);
L=AddElement(L,b,'Transform',[0,0,0,0,0,0]);
Plot(L,'linesmerge',1);
BoundingBox采用矩形的方式将所有的点包围。

Create radius (Flag=8)
%% AddLine
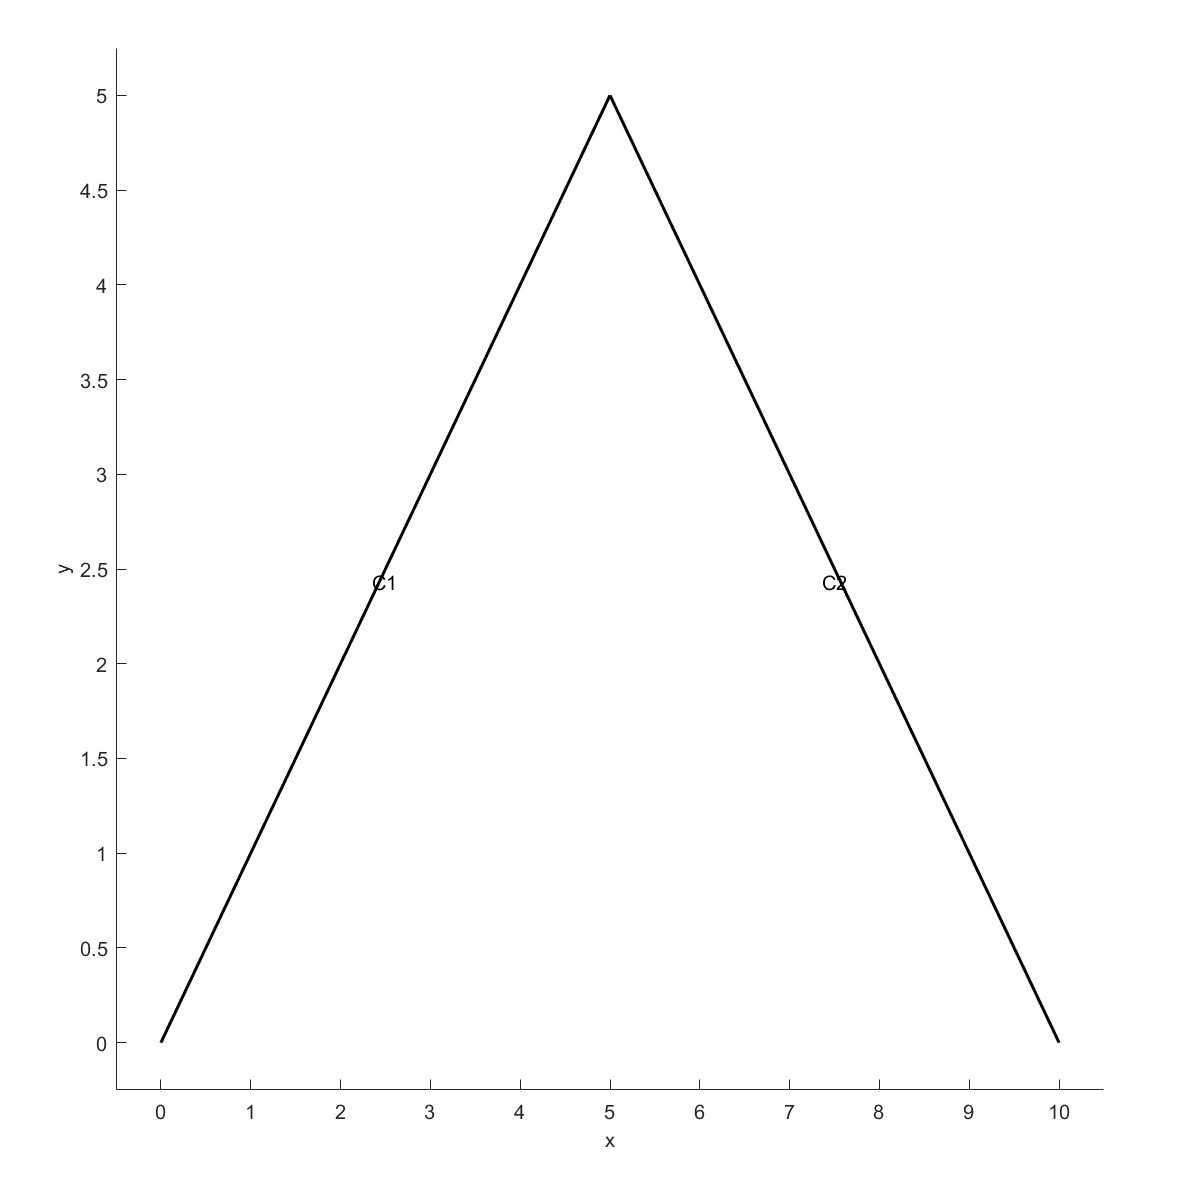
x1=[0;5];y1=[0;5];
x2=[5;10];y2=[5;0];
a=Point2D('Point Ass1');
a=AddPoint(a,x1,y1);
a=AddPoint(a,x2,y2);
b=Line2D('Line Ass1');
b=AddLine(b,a,1);
b=AddLine(b,a,2);
Plot(b,'clabel',1);
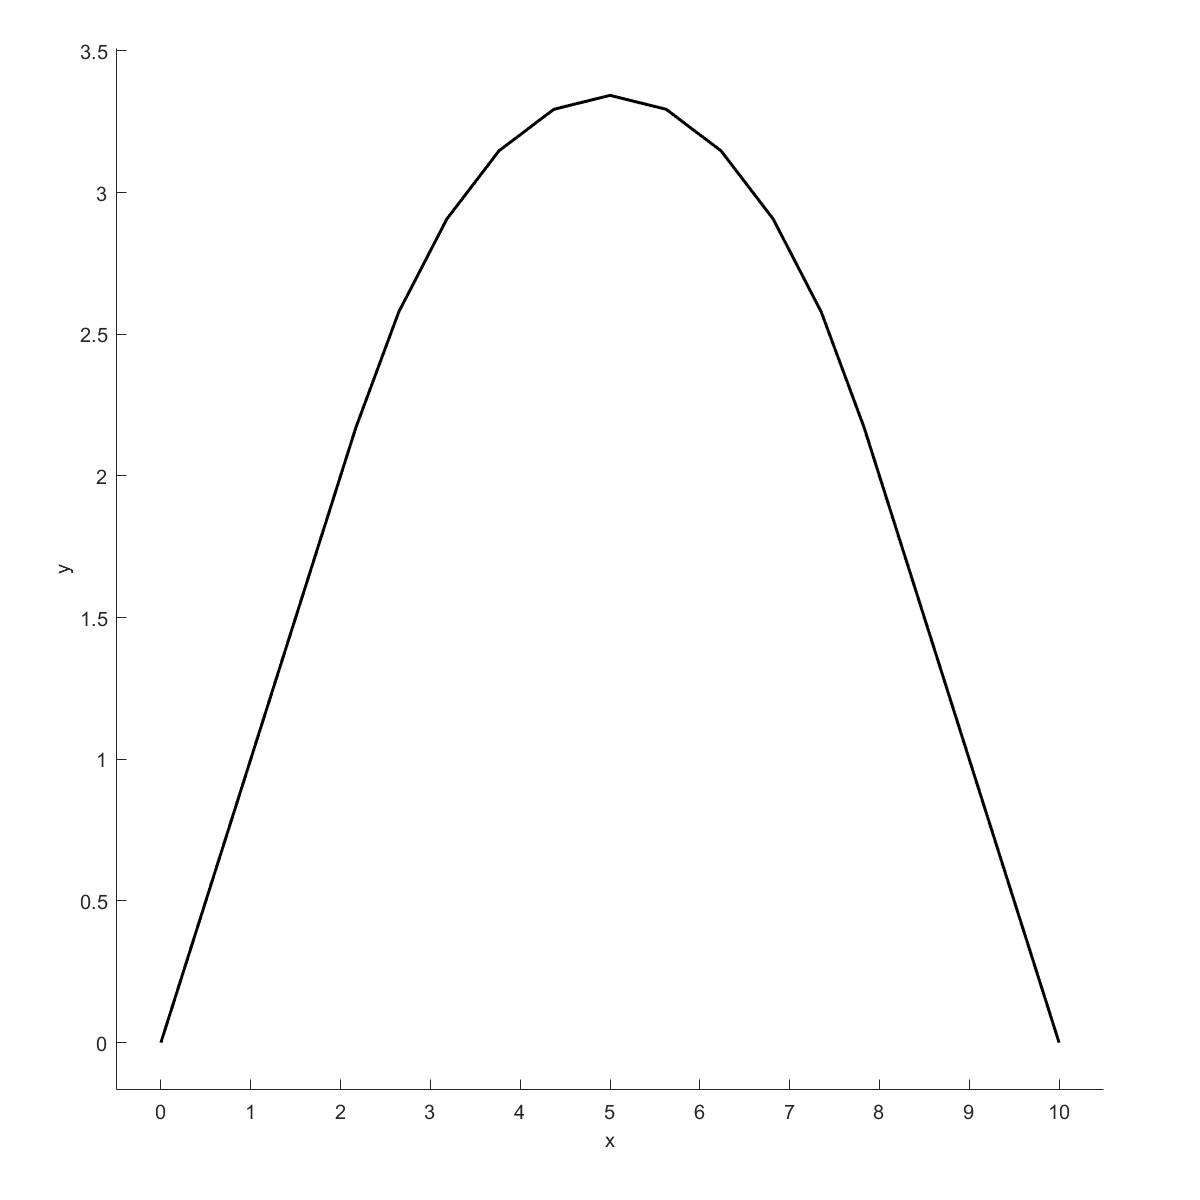
b = CreateRadius(b,1,4);
Plot(b)
绘制两根相交的线段,采用CreateRadius在相交处生成倒角。
 |  |
Circle fit (Flag=9)
% Create data for a circle + noise
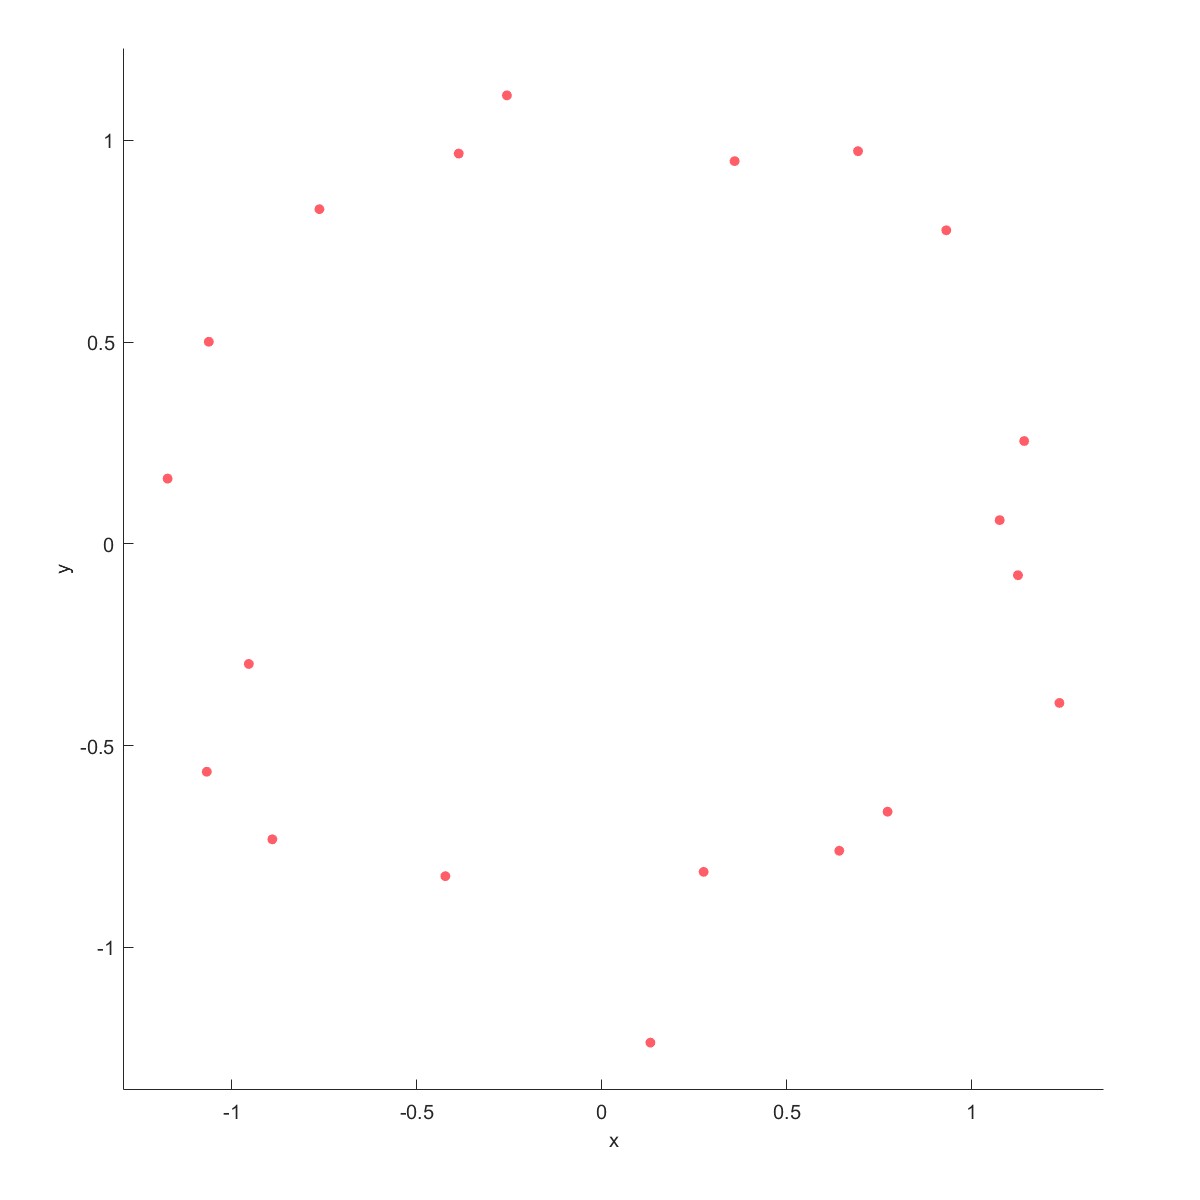
th = linspace(0,2*pi,20)';
R=1.1111111;
sigma = R/10;
x = R*cos(th)+randn(size(th))*sigma;
y = R*sin(th)+randn(size(th))*sigma;
a=Point2D('Point Ass1');
a=AddPoint(a,x,y);
Plot(a);
b=Line2D('Line Ass1');
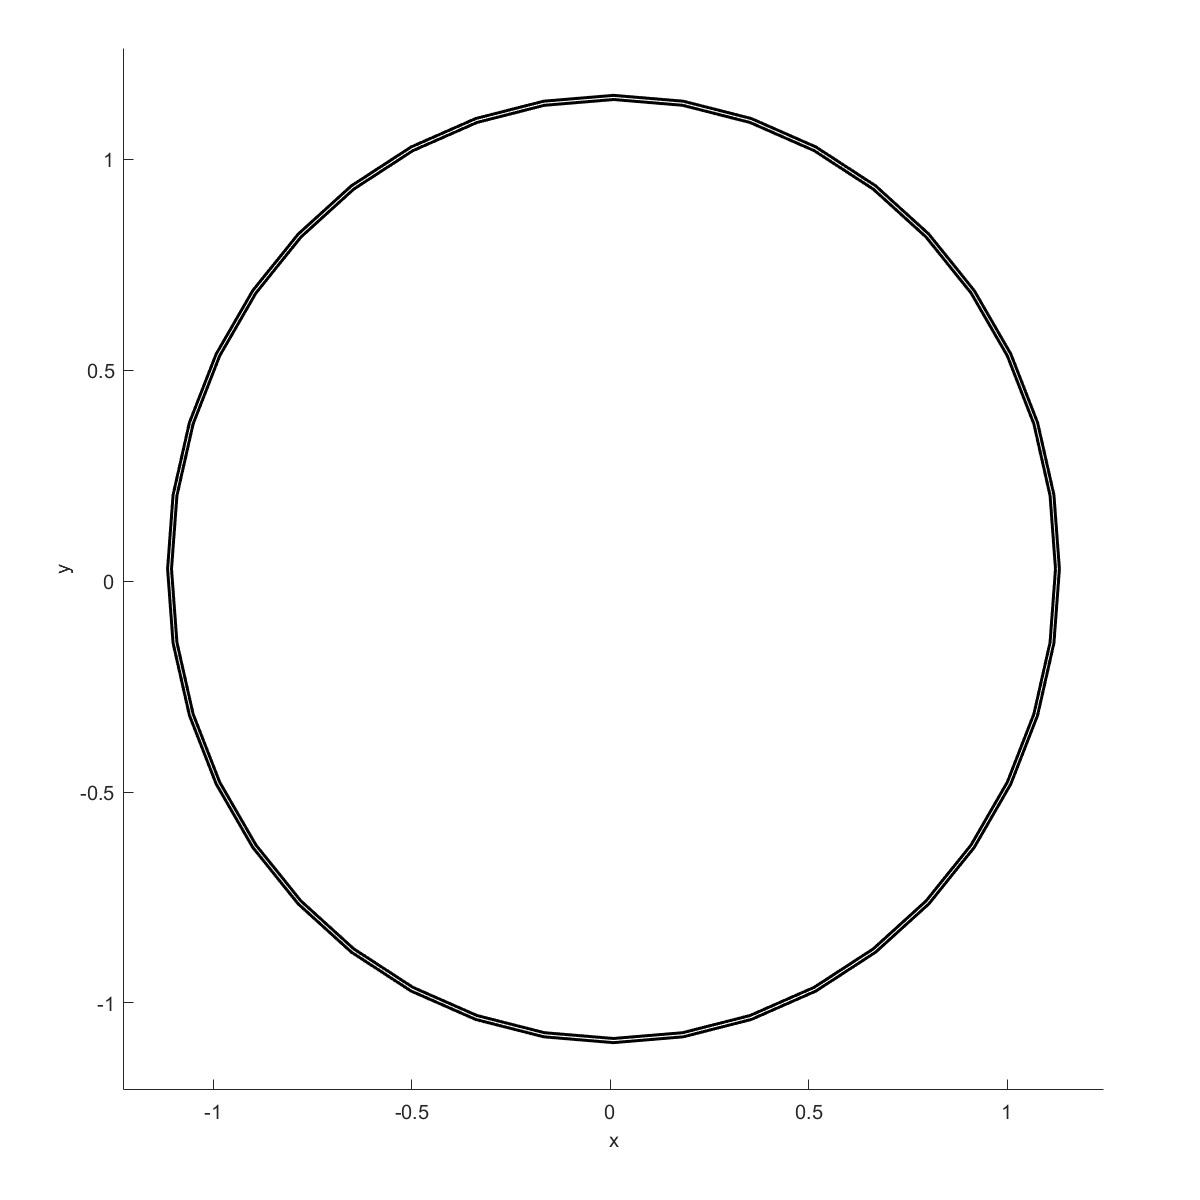
[b,~,~,~]=CircleFit(b,a,1);
[b,~,~,~]=CircleFit(b,a,1,'method','Taubin');
Plot(b);
Circle fit将散点拟合成圆形,设有两种方式 Taubin method$^{[6]}$和Pratt method$^{[5]}$,两种方法测试下来差别不大。
 |  |
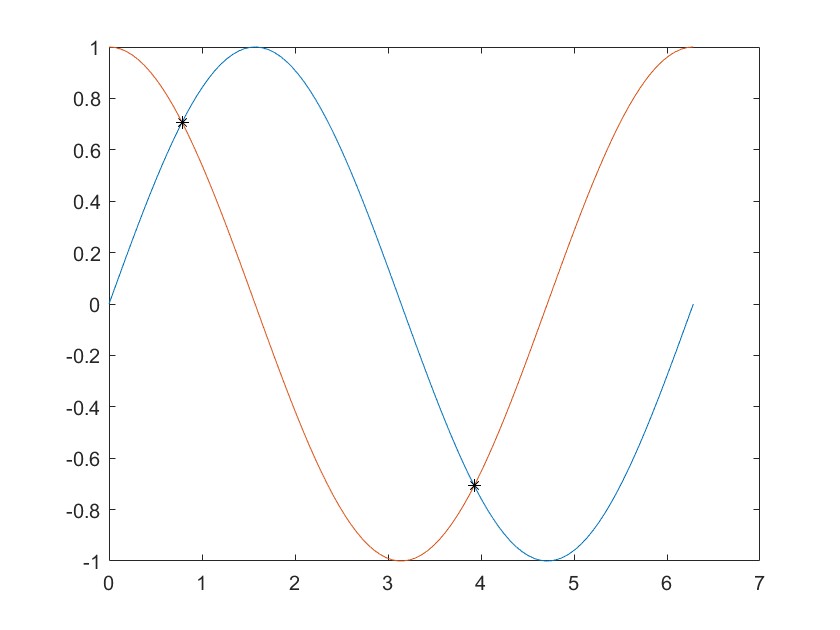
Curve Intersection (Flag=10)
x=linspace(0,2*pi,100);
y1=sin(x);
y2=cos(x);
plot(x,y1);hold on
plot(x,y2);hold on
a=Point2D('Point Ass1');
a=AddPoint(a,x',y1');
a=AddPoint(a,x',y2');
b=Line2D('Line Ass1');
b=AddCurve(b,a,1);
b=AddCurve(b,a,2);
[x0,y0]=CurveIntersection(b,1,2);
plot(x0,y0,'k*')
CurveIntersection计算曲线的交点$^{[7]}$
Add Round Polygon (Flag=11)
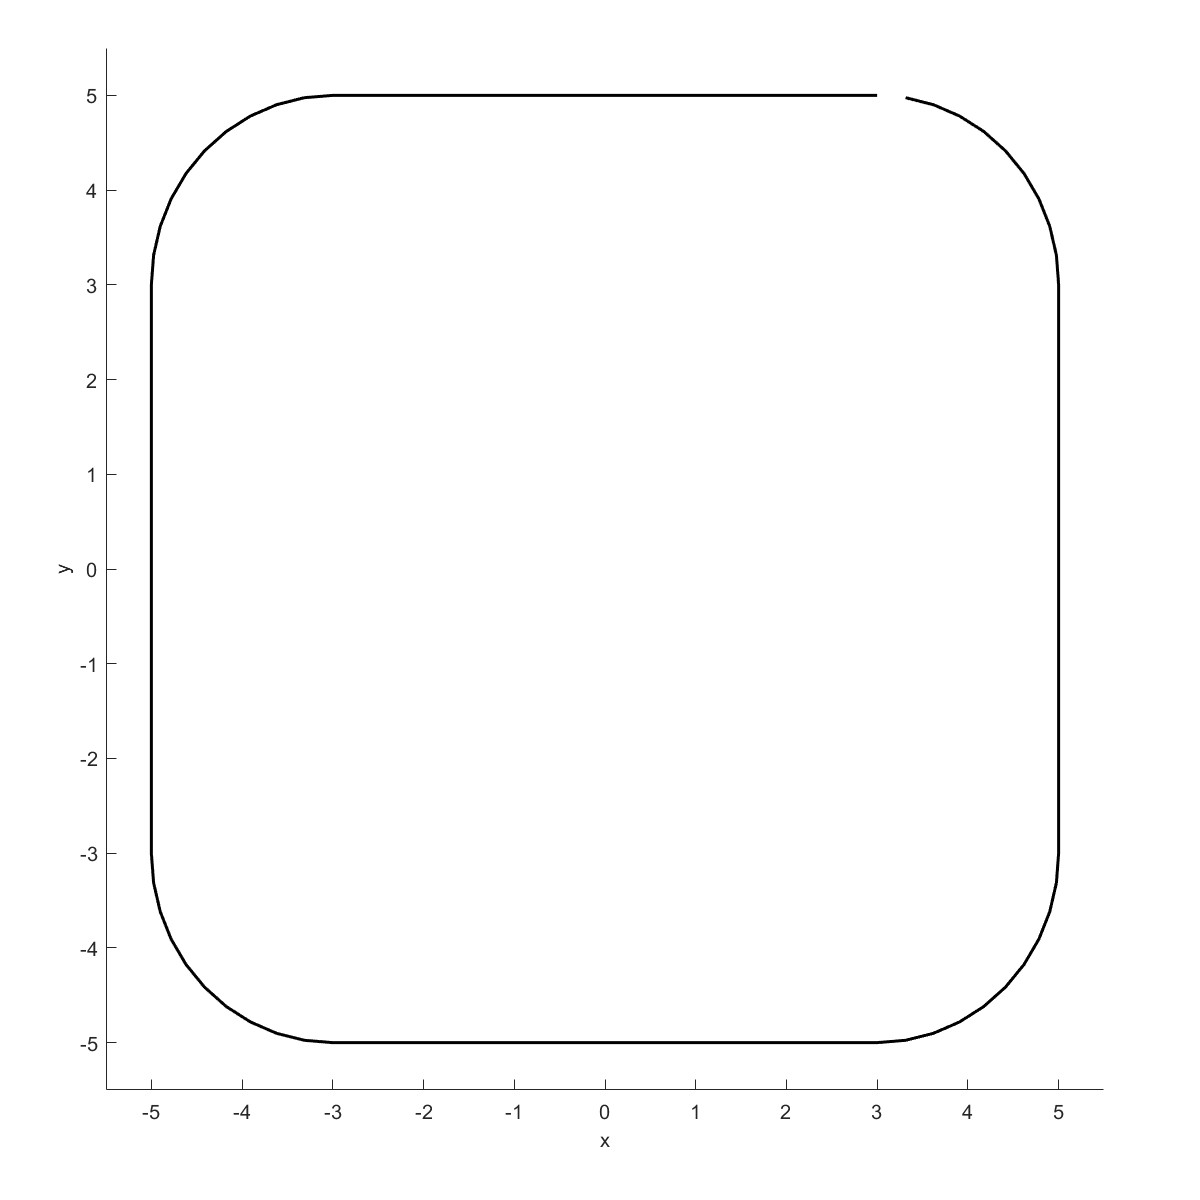
b=Line2D('Round Polygon');
b=AddRoundPolygon(b,5*sqrt(2),4,2,'sang',45);
Plot(b)
绘制圆角多边形。
Plot Line2D in ParaView (Flag=12)
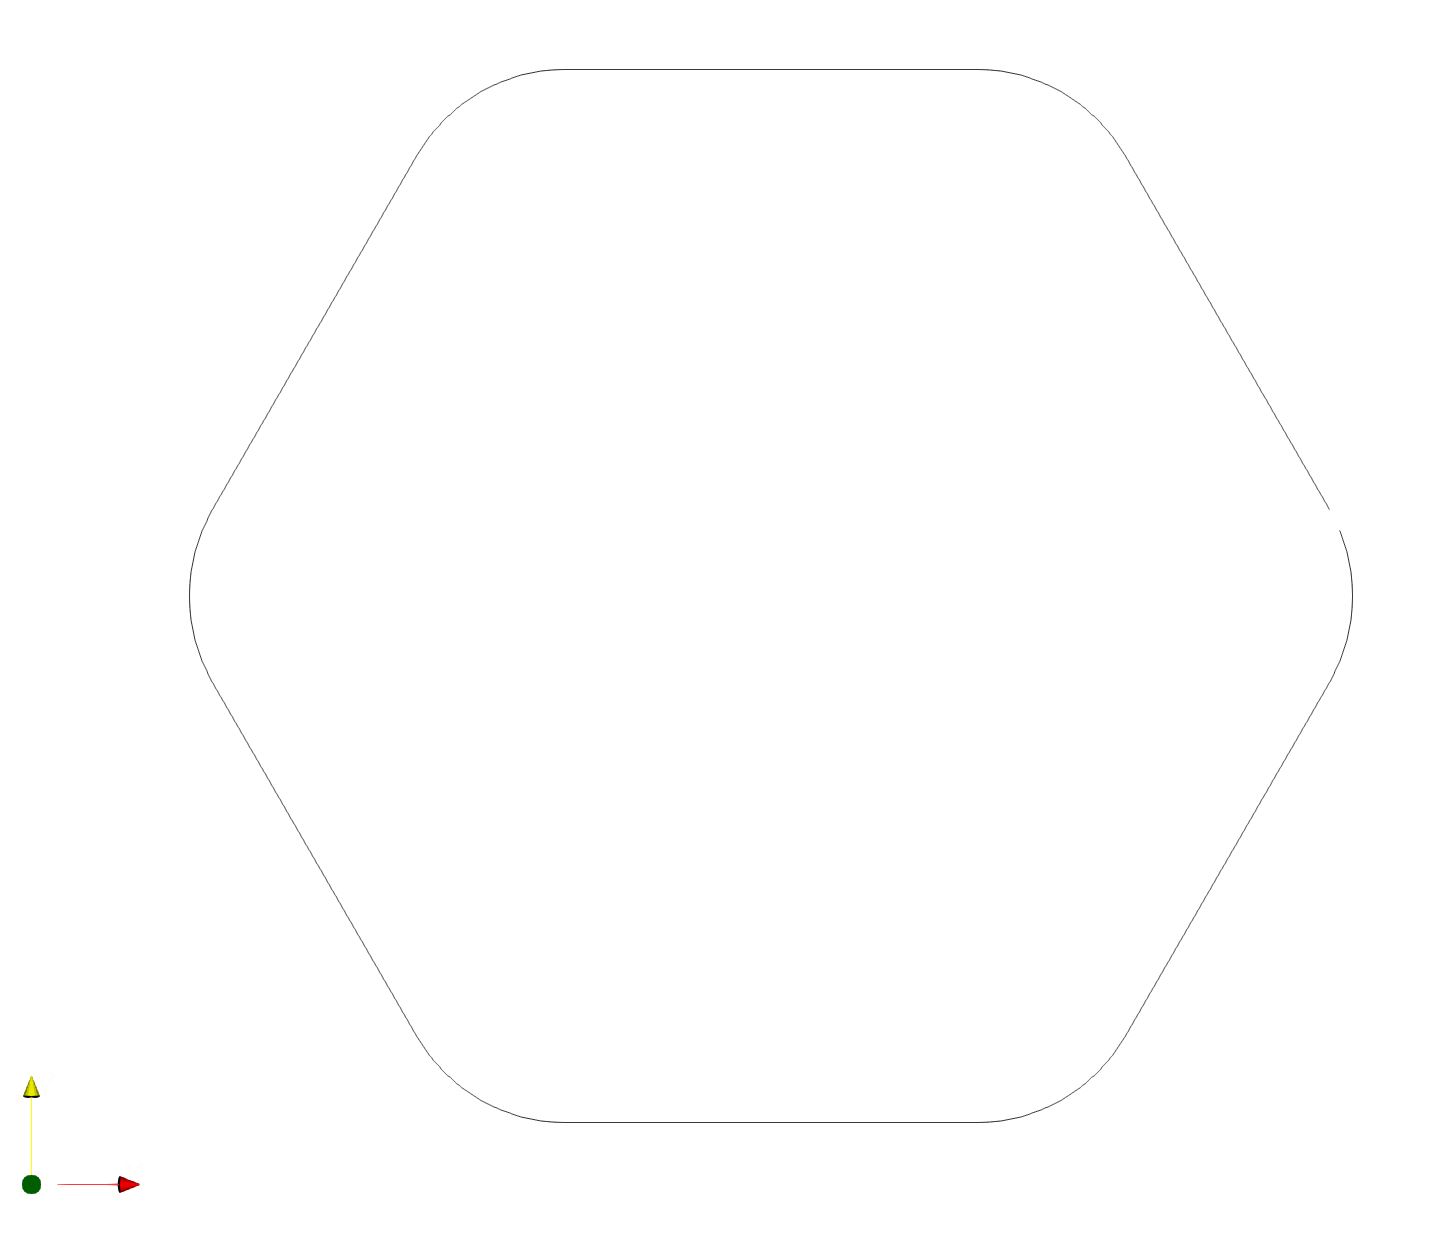
b=Line2D('Round Polygon');
b=AddRoundPolygon(b,5*sqrt(2),6,2);
Plot2(b)
Plot2可将曲线导出为VTK格式,并在Paraview中绘制。
Add Nurb curve (Flag=13)
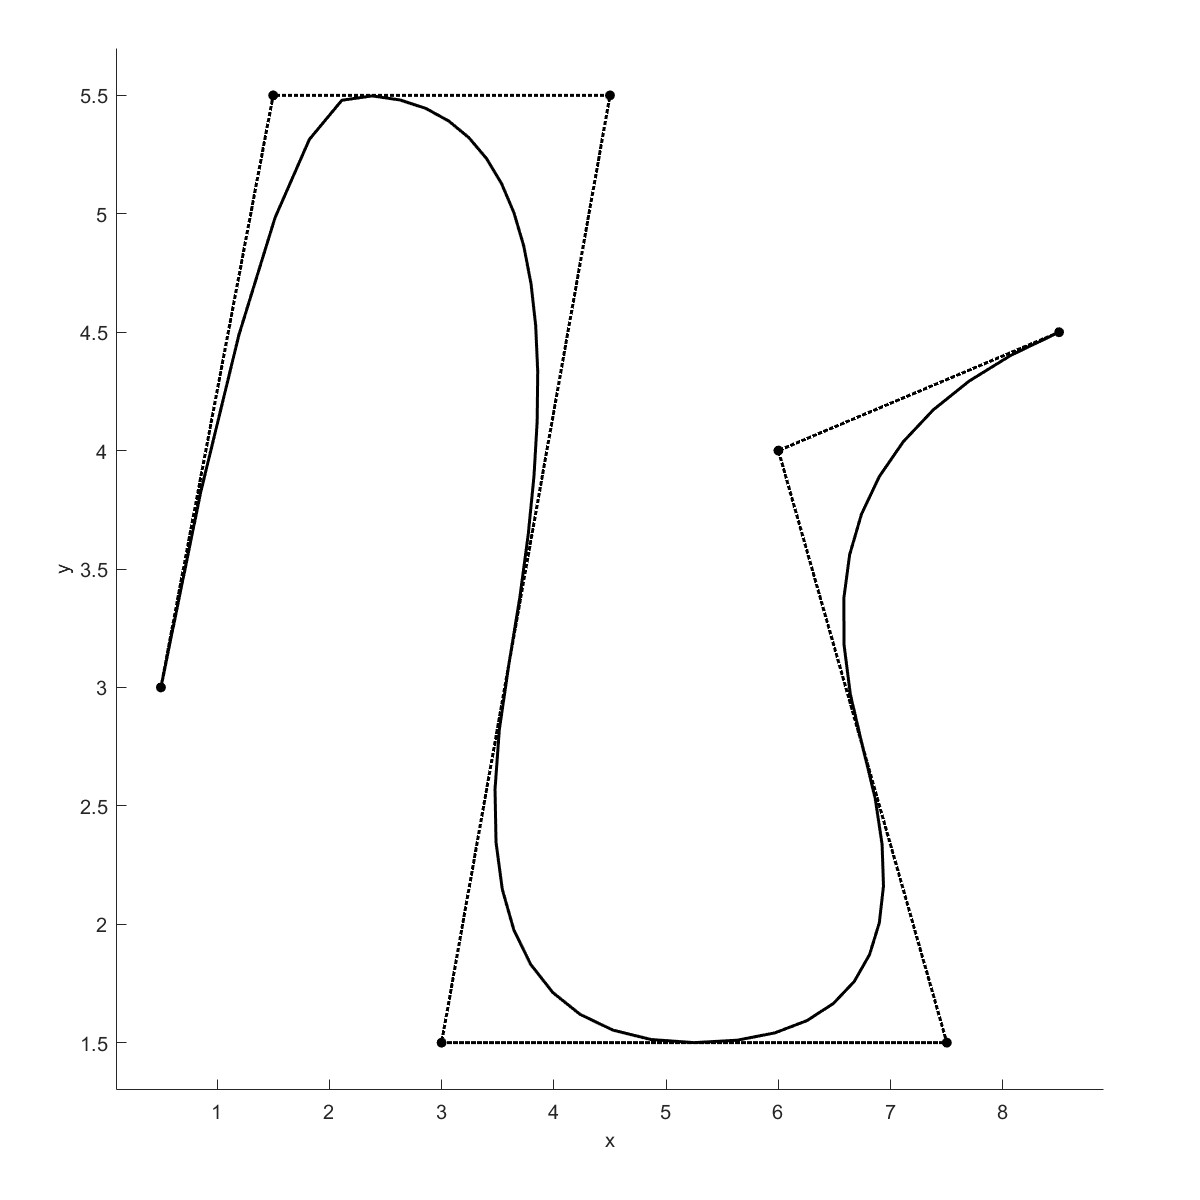
Points = [0.5 1.5 4.5 3.0 7.5 6.0 8.5;
3.0 5.5 5.5 1.5 1.5 4.0 4.5]';
Knots=[0 0 0 1/10 2/5 3/5 4/5 1 1 1];
b=Line2D('Nurb Test');
b=AddNurb(b,Points,Knots);
Plot(b);
PlotNurbs(b,'coefs',1);
AddNurb绘制Nurb曲线,参考于Nurbs tool$^{[8]}$.
Convert to nurbs (Flag=14)
%% AddLine
x1=[-1;1];
y1=[-3;-3];
a=Point2D('Point Ass1');
a=AddPoint(a,x1,y1);
b=Line2D('Line Ass1');
b=AddLine(b,a,1);
%% AddCurve
x2=[0;0.15;0.3;-0.3;0];
y2=[0;-0.5;-1;-1;0];
a=AddPoint(a,x2,y2);
b=AddCurve(b,a,2);
%% AddCircle
x3=-3;y3=2;
x4=3;y4=2;
x5=0;y5=0;
a=AddPoint(a,x3,y3);
a=AddPoint(a,x4,y4);
a=AddPoint(a,x5,y5);
b=AddCircle(b,0.5,a,3);
b=AddCircle(b,0.5,a,4);
b=AddCircle(b,5,a,5);
%% AddEllipse
x6=0;y6=-3;
a=AddPoint(a,x6,y6);
b=AddEllipse(b,1,0.5,a,6,'rot',-90,'sang',-90,'ang',180);
%% AddSpline
x7=[-4;-3;-2];y7=[2.5;3;2.5];
a=AddPoint(a,x7,y7);
b=AddSpline(b,1,a,7);
%% AddBezier
x8=[4;3;2];y8=[2.5;3;2.5];
a=AddPoint(a,x8,y8);
b=AddBezier(b,a,8);
%% AddBspline
x9=[-1.5;0;1.5];y9=[3;3.5;3];
a=AddPoint(a,x9,y9);
b=AddBspline(b,3,a,9);
Plot(b,'equal',1);
for i=1:9
b=Convert2Nurb(b,i);
end
PlotNurbs(b,'equal',1,'coefs',0);
Convert2Nurb可将多段线转环为Nurb曲线。
Add Cell data (Flag=15)
%% AddLine
x1=[-1;1];
y1=[-3;-3];
a=Point2D('Point Ass1');
a=AddPoint(a,x1,y1);
b=Line2D('Line Ass1');
b=AddLine(b,a,1);
%% AddCurve
x2=[0;0.15;0.3;-0.3;0];
y2=[0;-0.5;-1;-1;0];
a=AddPoint(a,x2,y2);
b=AddCurve(b,a,2);
%% AddCircle
x3=-3;y3=2;
x4=3;y4=2;
x5=0;y5=0;
a=AddPoint(a,x3,y3);
a=AddPoint(a,x4,y4);
a=AddPoint(a,x5,y5);
b=AddCircle(b,0.5,a,3);
b=AddCircle(b,0.5,a,4);
b=AddCircle(b,5,a,5);
%% AddEllipse
x6=0;y6=-3;
a=AddPoint(a,x6,y6);
b=AddEllipse(b,1,0.5,a,6,'rot',-90,'sang',-90,'ang',180);
%% AddSpline
x7=[-4;-3;-2];y7=[2.5;3;2.5];
a=AddPoint(a,x7,y7);
b=AddSpline(b,1,a,7);
%% AddBezier
x8=[4;3;2];y8=[2.5;3;2.5];
a=AddPoint(a,x8,y8);
b=AddBezier(b,a,8);
%% AddBspline
x9=[-1.5;0;1.5];y9=[3;3.5;3];
a=AddPoint(a,x9,y9);
b=AddBspline(b,3,a,9);
b=AddCellData(b,(1:9)');
Plot(b,'equal',1);
Plot2(b)
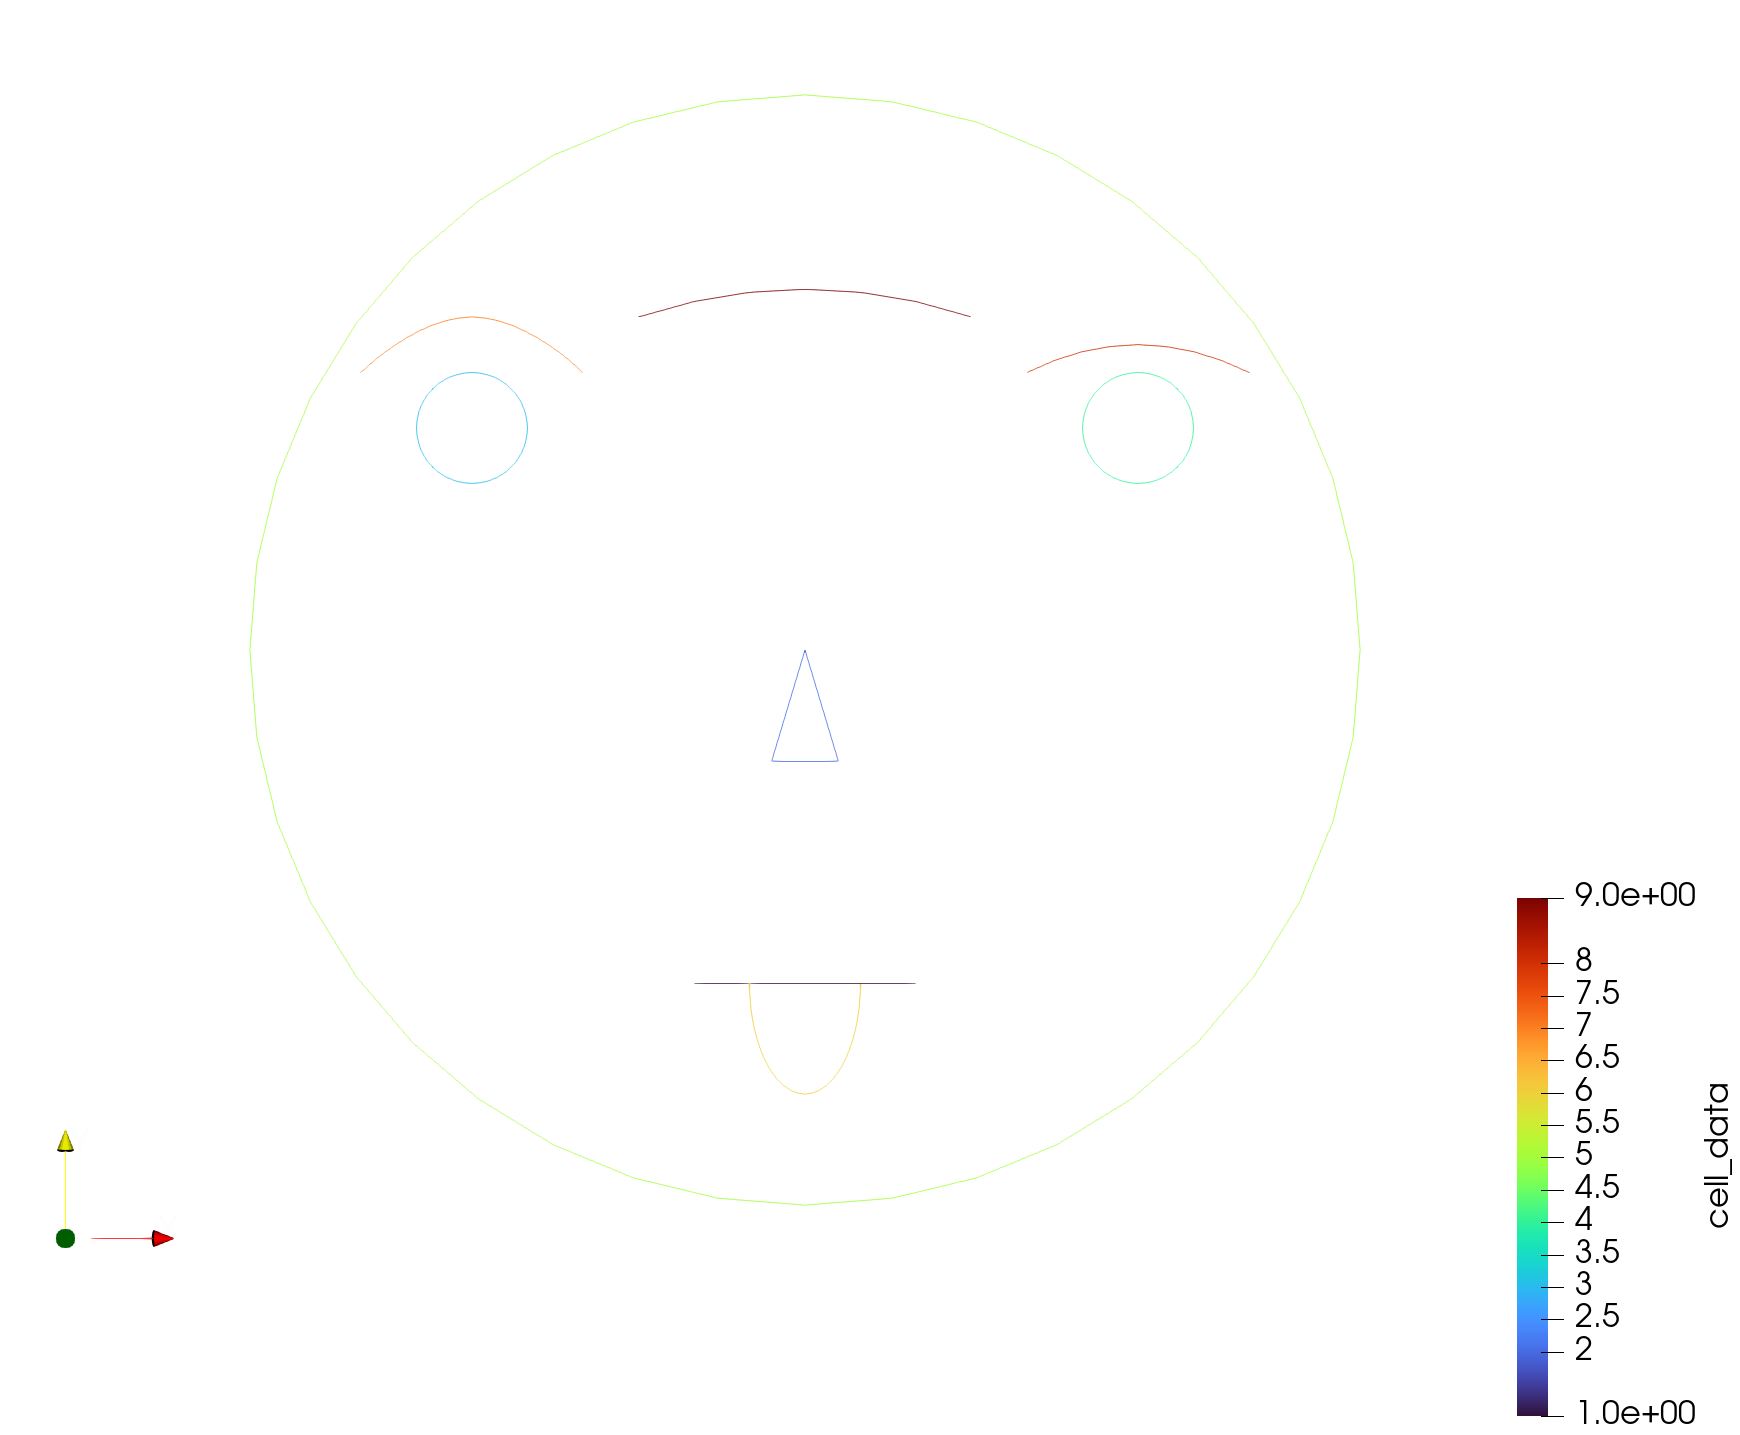
为曲线添加celldata,不同的曲线会有不同的色彩,celldata可以为计算分析中得到的值。
Max Inscribed Circle (Flag=16)
b=Line2D('Round Polygon');
b=AddRoundPolygon(b,5*sqrt(2),4,2);
b=MaxInscribedCircle(b,1);
Plot(b)
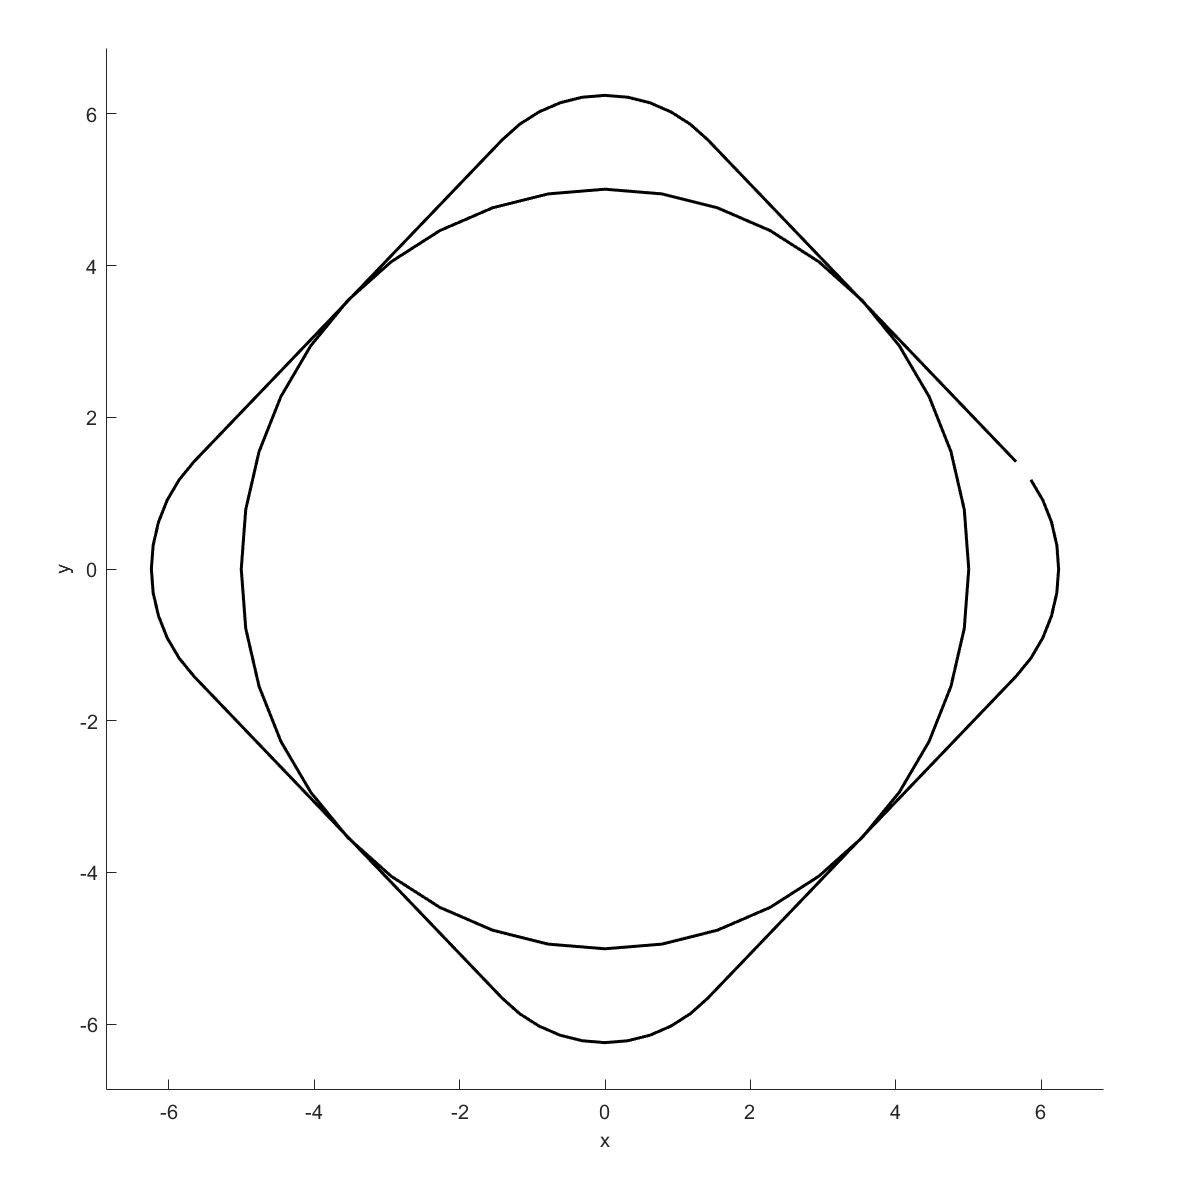
计算最大内切圆$^{[9]}$
ArchFit (Flag=17)
load N_5 N_5
a=Point2D('Point Ass');
a=AddPoint(a,N_5(:,1),N_5(:,2));
b=Line2D('Line Ass');
b=AddCurve(b,a,1);
Plot(b);
bFit=ArchFit(b,1,0.1,4,1.7);
Plot(bFit)
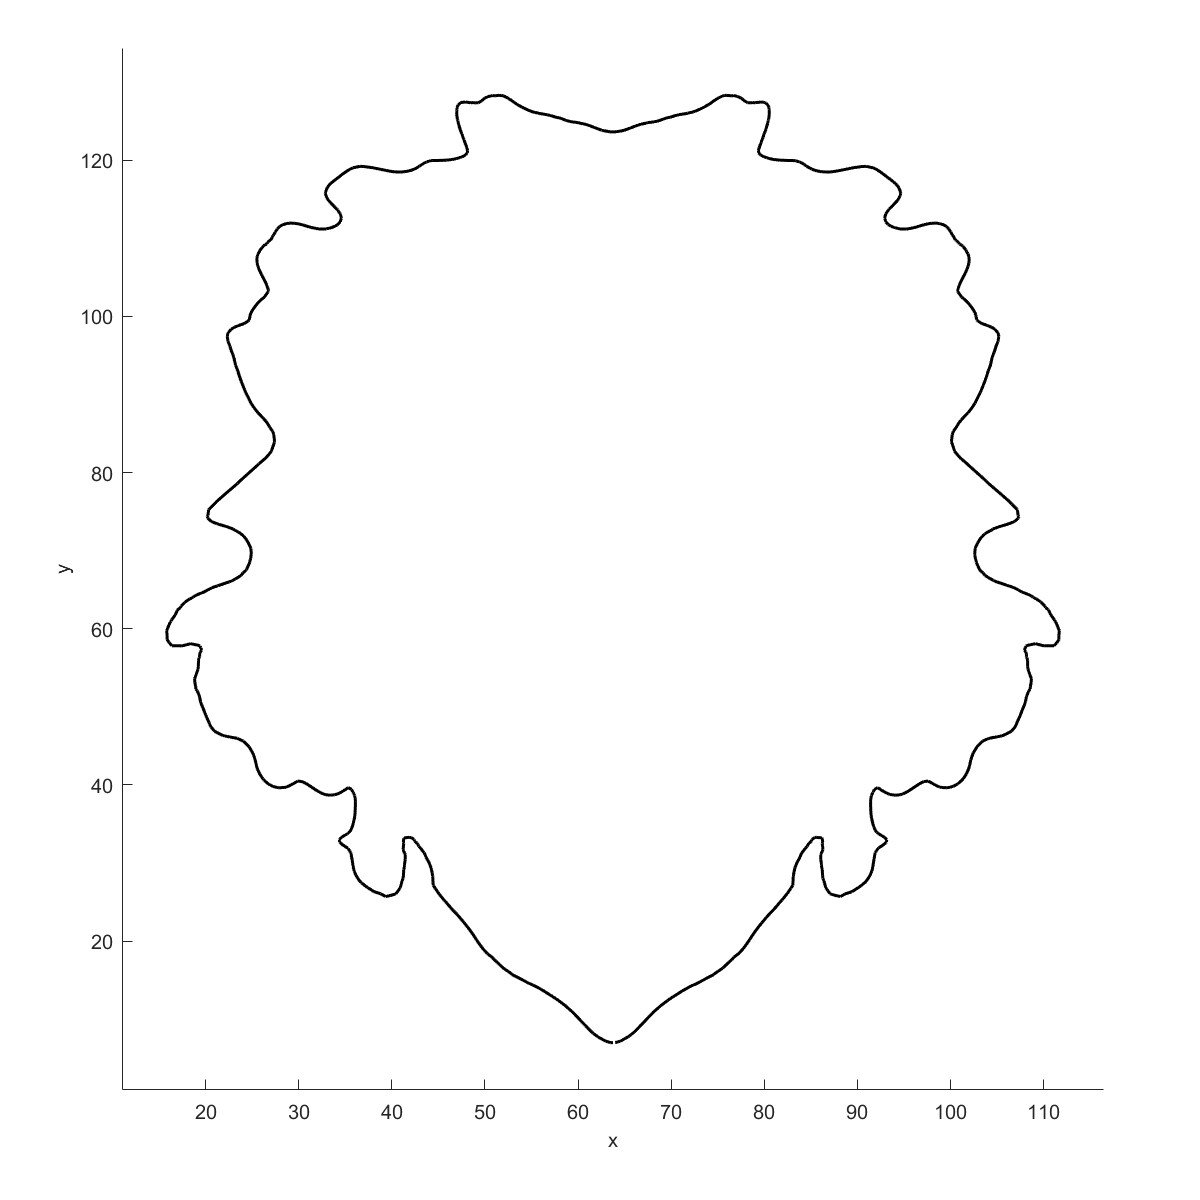
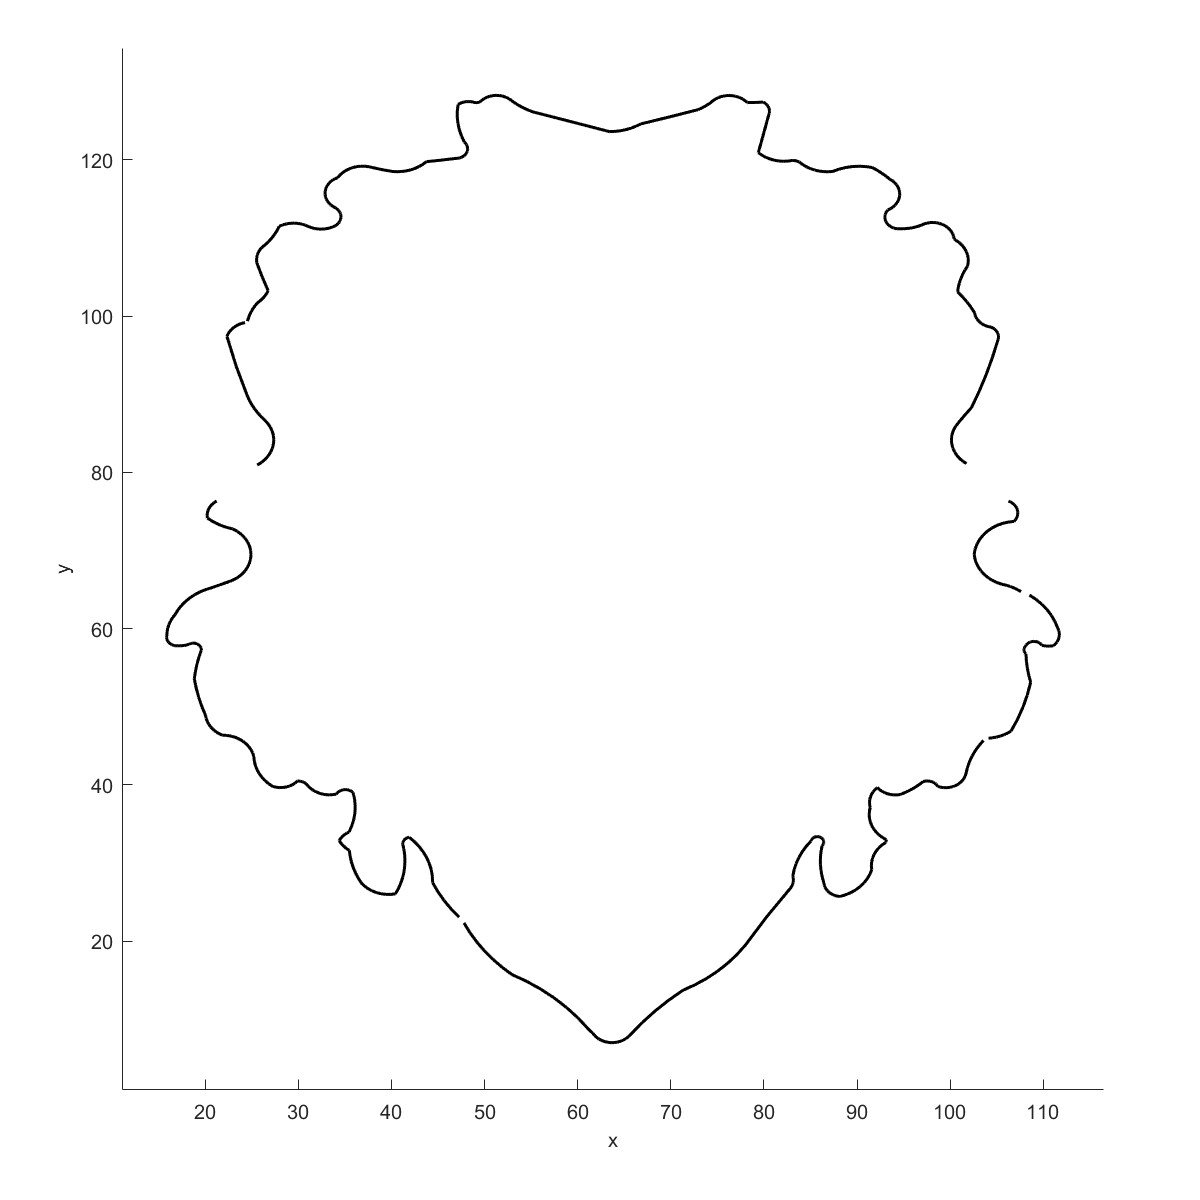
将曲线用圆弧来拟合$^{[10]}$,在切割加工的场景下会有很多应用。
 |  |
CheatTable
| Name | Varargin | Description |
|---|---|---|
| AddBezier(obj,Point2D,P) | AddbBezier curve | |
| AddBspline( obj, c, Point2D, P ) | Add bspline curve | |
| AddCellData(obj,Data) | Add cell data to curve | |
| AddCircle(obj,r,Point2D,P) | ‘sang’,’ang’,’seg’ | Add circle |
| AddCurve(obj,Point2D,P) | Add curve | |
| AddEllipse( obj, a, b,Point2D,P) | ‘rot’,’sang’,’ang’,’seg’ | Add ellipse |
| AddHyperbola( obj, a, b,Point2D,P) | ‘rot’,’t1’,’t2’ | Add hyperbola |
| AddLine(obj,Point2D,P) | Add straight line | |
| AddLineThickness(obj,id,Thickness,theta) | ‘add’,’close’ | Offset curve |
| AddNurb(obj,coefs,knots) | ‘seg’ | Add nurb curve |
| AddParabola(obj,f,Point2D,P) | ‘rot’,’t1’,’t2’ | Add parabola |
| AddPolygon(obj,r,seg) | ‘sang’,’close’ | Add polygon |
| AddRoundPolygon(obj,r,seg,fillet) | ‘sang’ | Add round polygon |
| AddSpline( obj, ctype, Point2D, P ) | ‘a1’,a2’,’s1’,’s2’ | Add spline |
| AddStar(obj,N,r) | ‘sang’,’close’,’anglelimit’ | Add star |
| ArchFit(obj,LineNum,e,min_dots,max_dist) | Curve arch fit | |
| Boundary(obj,PP) | ‘scale’,’group’ | Calculate boundary of points |
| BoundingBox(obj,PP) | ‘group’ | Calculate box boundary of points |
| CircleFit(obj,PP,P) | ‘method’ | Circle fit of points |
| Convert2Nurb( obj,CrvNum) | ‘seg’ | Convert poly curve to nurb curve |
| CreateRadius(obj,l1,Radius) | Round corner of curves | |
| CurveIntersection(obj,l1,l2) | Calculate intersection of curves | |
| DeleteCurve(obj,ic) | Delete curve | |
| GetCurve(obj,id) | Get curve points | |
| GetNcrv(obj) | Get total number of curve | |
| GetNNurb(obj) | Get total number of nurb | |
| Help(obj) | Open help file | |
| MaxInscribedCircle(obj,LineNum) | Get the maximum inscribed circle that fits inside | |
| Meshoutput(obj) | Output Line2D mesh | |
| NrbEval(obj,nurbsnum,tt) | Evaluate a NURBS at parameteric points | |
| Plot(obj) | ‘grid’,’axe’,’clabel’,’styles’, ‘equal’,’crv’,’map’,’color’, ‘base_size’,’xlim’,’ylim’ |
Plot line2D object |
| Plot2(obj) | Plot line2D on paraview | |
| PlotNurbs(obj) | ‘grid’,’axe’,’clabel’,’styles’, ‘equal’,’crv’,’map’,’base_size’, ‘xlim’,’ylim’,’coefs’ |
Plot nurb curves |
| PolyCurve( obj, id) | ‘hmax’,’opt’ | Polynomal approx. of the curve |
| RebuildCurve(obj,num,n) | ‘interPar’,’closeLoopOpt’, ‘spacingFlag’ |
Rebuild curve |
| Shift(obj,ic,seq) | Change the sequence of the lines | |
| VTKWrite(obj) | Write VTK file of 2D |
参考文献
[1] https://www.mathworks.com/matlabcentral/fileexchange/72573-fem19?s_tid=srchtitle
[2] https://www.researchgate.net/publication/335465380_FEM19_Quick_Startpdf
[3] https://www.researchgate.net/publication/335465632_FEM19_Examples_v01pdf
[4] https://www.researchgate.net/publication/335465623_FEM19_Manual_v01
[5] https://ww2.mathworks.cn/matlabcentral/fileexchange/22643-circle-fit-pratt-method?s_tid=srchtitle
[6] https://ww2.mathworks.cn/matlabcentral/fileexchange/22678-circle-fit-taubin-method?s_tid=srchtitle
[7] https://ww2.mathworks.cn/matlabcentral/fileexchange/11837-fast-and-robust-curve-intersections?s_tid=srchtitle
[8] https://ww2.mathworks.cn/matlabcentral/fileexchange/26390-nurbs-toolbox-by-d-m-spink?s_tid=srchtitle
[9] https://ww2.mathworks.cn/matlabcentral/fileexchange/71995-max_inscribed_circle?s_tid=srchtitle
[10] https://ww2.mathworks.cn/matlabcentral/fileexchange/68439-polyline-approximation-with-arcs-and-segments?s_tid=srchtitle
本网站基于Hexo 3-Hexz主题生成。如需转载请标注来源,如有错误请批评指正,欢迎邮件至 392176462@qq.com